How to mix and master for streaming services
Find out how the loudness rules have changed after the 'loudness wars' of the '00s, and how you can mix and master accordingly

For decades, many producers and engineers were locked in an arms race. From music’s birth as a mass media product pressed to vinyl, through the CD revolution, the objective of many in the industry was to make each track as loud as possible – louder than the last, and loud enough to compete with the songs on the radio that came before and after. The loudness war escalated until 2010, when a new AES/EBU standard sought to impose a change for the quieter.
In short, today’s streamed music standards leave far fewer incentives for musicians to squeeze a tune to within an inch of its life. Platforms such as YouTube, Spotify and Apple Music will actually analyse an uploaded track, turning down one that’s ‘coming in too hot’, and turning up one that’s a calmer, smoother mix with more dynamics.
For listeners, the result is a far more reliable listening experience. A death metal track can be followed by a smooth jazz tune, and theoretically there’ll be no need to touch the volume control – the differences in average loudness of the two songs will have been compensated for by the streaming service behind the scenes.
For engineers, this new approach to loudness means that mastering is a more forgiving process. Instead of focusing on the commercial realities of loudness, more space is available for nuance and dynamic in the music. But how do these standards actually work? And how can you implement them in your music? Read on to find out.
The document that stopped the war
You’ll have heard the terms Peak and RMS when referring to audio signal level. Peak is the instantaneous maximum value of the signal – the highest point it has reached; while RMS provides a value for the average level of a signal over time. RMS gives a good representation of how loudness is experienced by humans; Peak tends to represent the maximum capacity of the system used to play it.
During the loudness wars, the highest peak was a set value. In the days of the CD, music was carried with an amplitude range across 16 bits. There was a definite peak level that a piece of digital music theoretically couldn’t cross: when those 16 bits were full of 1s. With the Peak level set and unchangeable, the incentives were aligned for engineers to raise the RMS value as loud as they possibly could.
In 2010, the European Broadcasting Union issued EBU R 128, a recommendation for a system of Loudness Normalisation. This specified a way to measure the perceived loudness of an audio signal, and crucially, a target level for that signal. If a piece of music has an average loudness above that level, it is to be turned down; if below that level, it should be turned up.
Want all the hottest music and gear news, reviews, deals, features and more, direct to your inbox? Sign up here.
Stop! in the name of LUFS
The new system replacing RMS level (for our purposes here), is a system of Loudness Units (LU). The Full Scale value (LUFS) measures an absolute loudness and is referenced to 0dBFS. To get the actual measurement, the signal is K-weighted with a high-pass filter and a 4dB increase above 1kHz.
The EBU’s recommendation is for streamed music to aim for a target level of -23 LUFS. Streaming platforms have got onboard with this somewhat, with Spotify and YouTube normalising to -14 LUFS, Apple Music to -16 LUFS, and Amazon normalising to between -9 and -13 LUFS.
Dynamic range, then and now
Before the R 128 standard, decades of squeezing music’s dynamic range ended up leaving us very squashed. A look through the data on the Dynamic Range Database will give you a few figures to show the extent of the situation.
This resource lets you search for artists and albums – or simply check out all albums at once – and view their dynamic range stats with average, minimum and maximum figures. While not taking into account figures such as True Peak (discussed later) and exact LU, the amount of headroom left in the tracks by the people who worked on them still sheds some light on the state of the loudness wars.
Streaming services are not currently responding to LRA when calibrating uploaded tracks, so even if a relatively small portion of the audio signal gets particularly loud, the entire track will be compensated
Rarely do today’s albums make it close to 14dB of dynamic range, a figure that the site gives as the ideal and measures with a green box. Scroll through your favourite artist’s list of records, and you’ll often see a whole sea of red. The site measures the masters of any album’s vinyl, download and CD release separately, making it easy to note that vinyl releases often – although not always – offer more maximum dynamic range than their CD and download counterparts would.
Another interesting thing to rank is the differences in dynamic range over time, whether that’s in new material, remasters, or simply work from different artists released at different times.
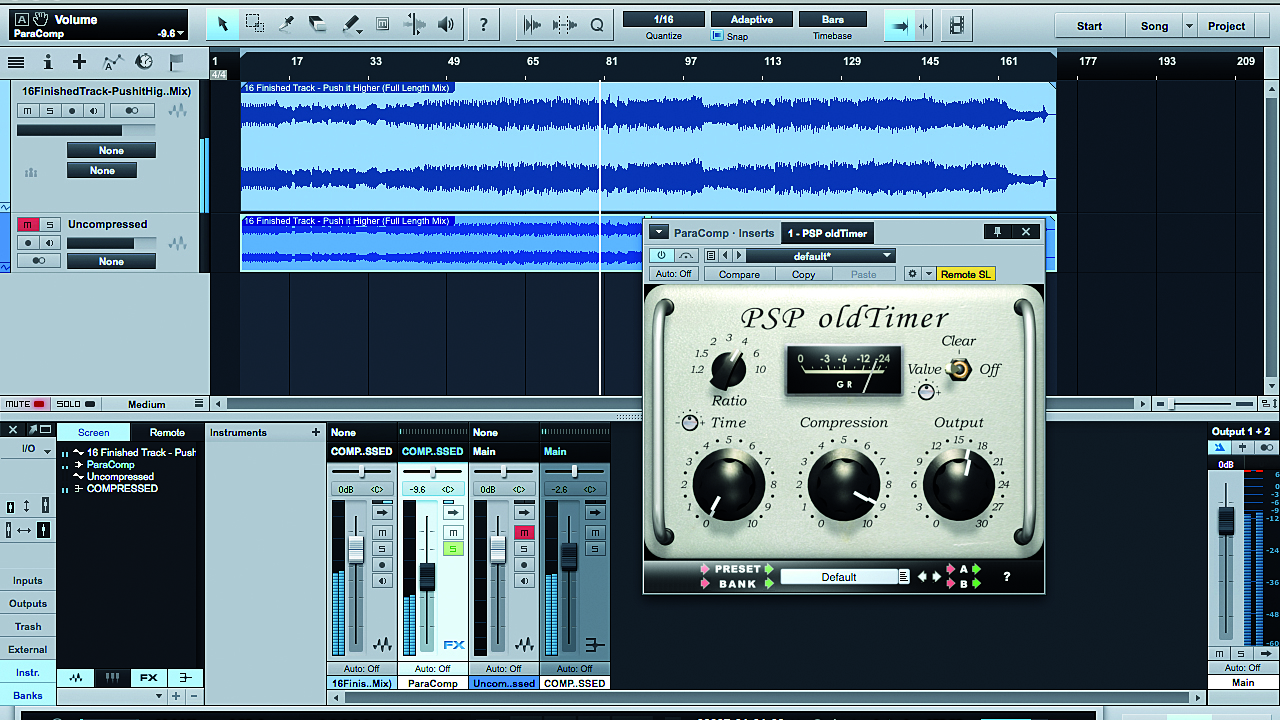
Take The Rolling Stones, for example – the site shows a steadily wide dynamic range (a sea of green) throughout the ’70s and ’80s, although the data is often taken from CD releases of albums recorded in earlier years.
Fast-forward to the mid-2000s, and the situation does start to change a certain amount, with the dynamic range of the band’s music being squeezed. While there are some let-ups, the general trend from then on was for the recordings to reduce in dynamic range as time went on. These days, though, there’s plenty of variation in the ageing band’s recordings, but no overwhelming resolution towards being over- or under- compressed.
It’s important to remember that the dynamic range statistics don’t measure loudness per se, but at the very least, the website is an interesting read.
Peaking too early
Despite the move away from using a signal’s peak level as the be-all and end-all, the new loudness standards haven’t ignored the concept. True Peak is a new way to measure the loudest points in the audio signal by recreating how a real, continuous audio signal actually behaves. MeterPlugs’ Ian Kerr explains for us…
“A typical ‘sample peak’ meter will simply look at discrete samples to determine the peak level. The problem with this is that the samples may not have been taken when the continuous signal was at its peak, so in these cases the sample peak meter will report a lower peak level than the actual peak level.
“This can lead to problems further downstream when processing decisions are based on this ‘faulty’ peak level. For example, suppose a mastering engineer applies compression and limiting to track, aiming for a sample peak level of -1dB.
Loudness may be measurable, but over what time span we do it can make a difference
"It’s entirely possible that the actual, continuous peak level will exceed 0dB in this case! When the track is ultimately converted back to a continuous signal for listening (by a digital to analogue Converter), this could lead to distortion and artefacts when the track is encoded.
“True Peak meters aim to mitigate this issue by detecting inter-sample peaks: the peaks that occur between discrete samples. They do this by upsampling the digital signal, from 48kHz to 192kHz, for example. This reduces the likelihood that a ‘true’ peak will be missed, or reduces the amount by which it is missed, at least.
The result is that True Peak measurements more accurately reflect the actual peak levels than a sample-peak measurement.”
Loudness range issues
Loudness may be measurable, but over what time span we do it can make a difference. The EBU Mode specifies three sliding time windows over which to measure loudness. Momentary has a window of 400ms, which helps to meter transient and highly dynamic material; Short-term increases the window to 3s, giving a wider view of the loudness in a musical context; Integrated keeps track throughout an entire track, and can shed some light on the potential pitfalls of the new methods for working with loudness.
If LUFS and True Peak are taking the helm when it comes to measuring loudness, and are responsible for streaming services’ fiddling with the volume of any track on playback, then how do we account for the fact that music changes in loudness throughout individual tracks?
This is measured with LRA, a Loudness Range number that describes the integrated difference in LU throughout a track. Let’s say a piece of music starts with some ambient sounds and background noise, has a light, acoustic guitar intro and eventually builds to a momentous climax before bringing things right back down again – the LRA for this track would be relatively high. On the other hand, a modern techno tune without much variation may remain quite consistent across its length, which will then give us a lower LRA reading.
It seems streaming services are not currently responding to LRA when calibrating uploaded tracks, so even if a relatively small portion of the audio signal gets particularly loud, the entire track will be compensated for based on this one portion. Even the quieter parts will be turned down.
EBU R 128 may have established a steady peace after the loudness wars, but one unintended consequence is that it incentivises a reduction in the LRA throughout any given track, and so entire pieces of music may end up with fewer changes in loudness per section.
How to use Mastering The Mix Levels to prep for streaming
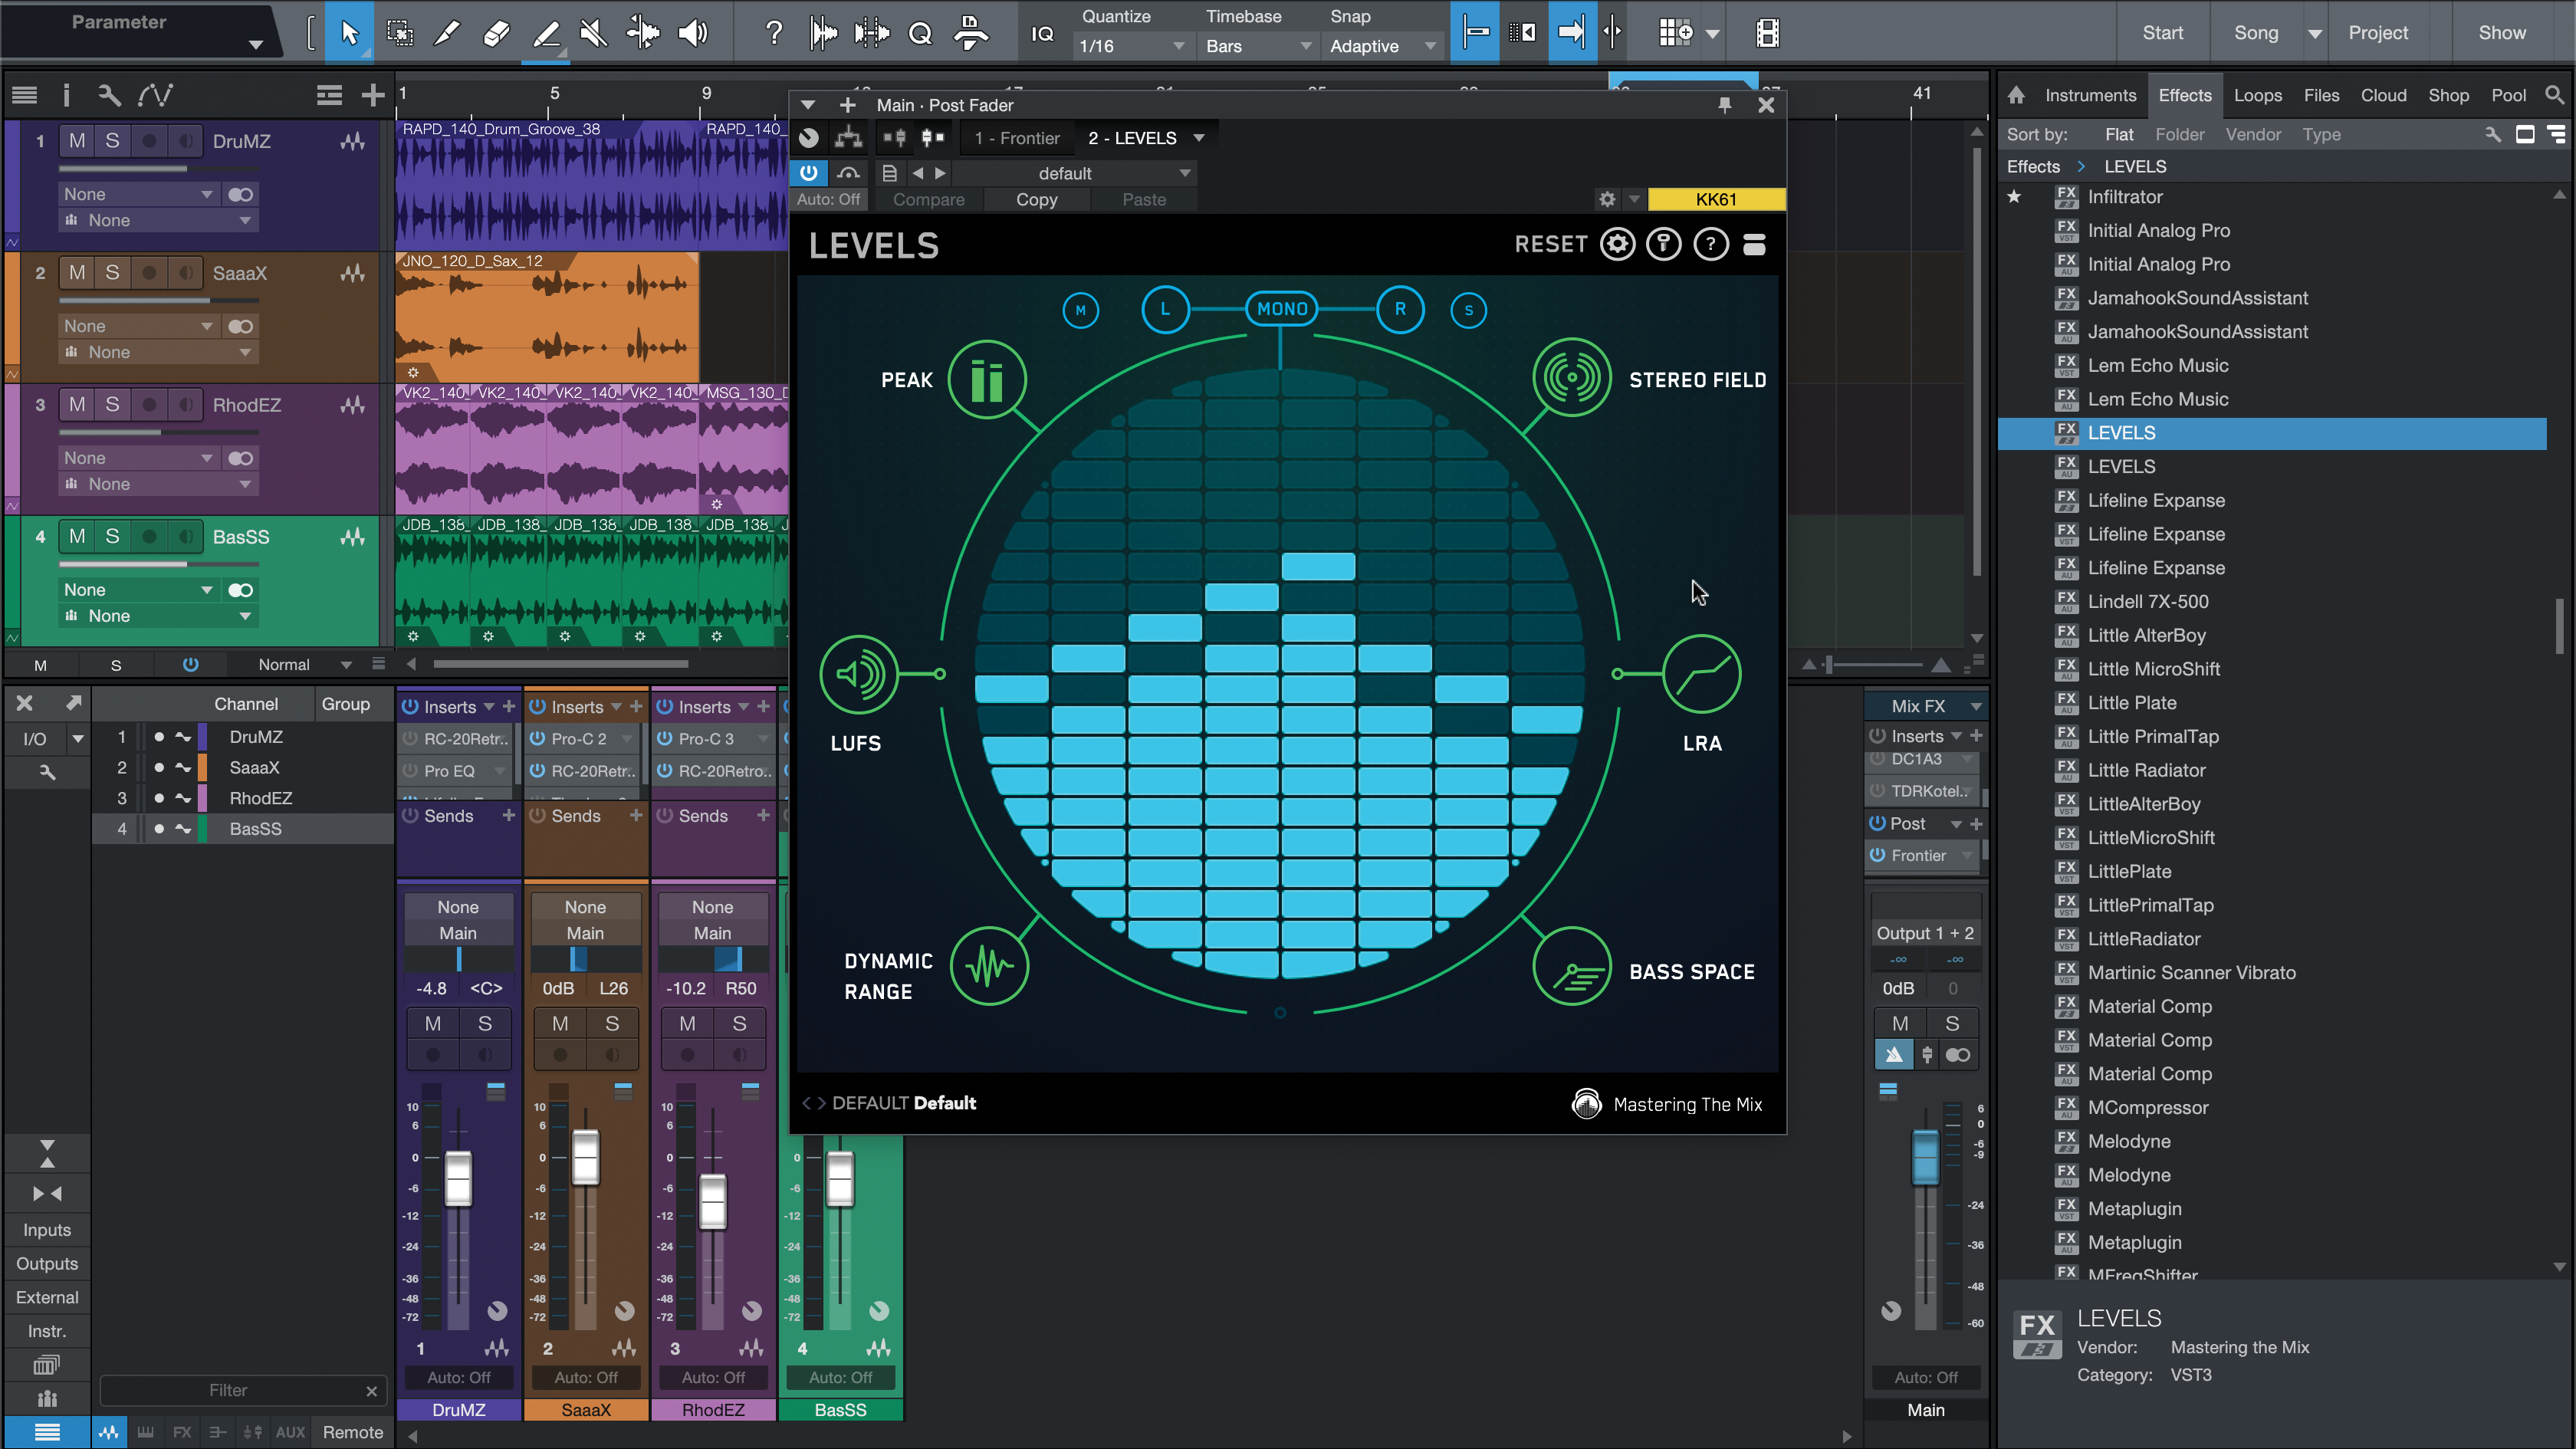
Step 1: Let’s put some of this mixing and mastering knowledge into practice. Here’s Mastering The Mix’s plugin Levels, which lets you know how your audio is shaping up against various commercial and theoretical standards. Levels goes on the master bus, after all processing.
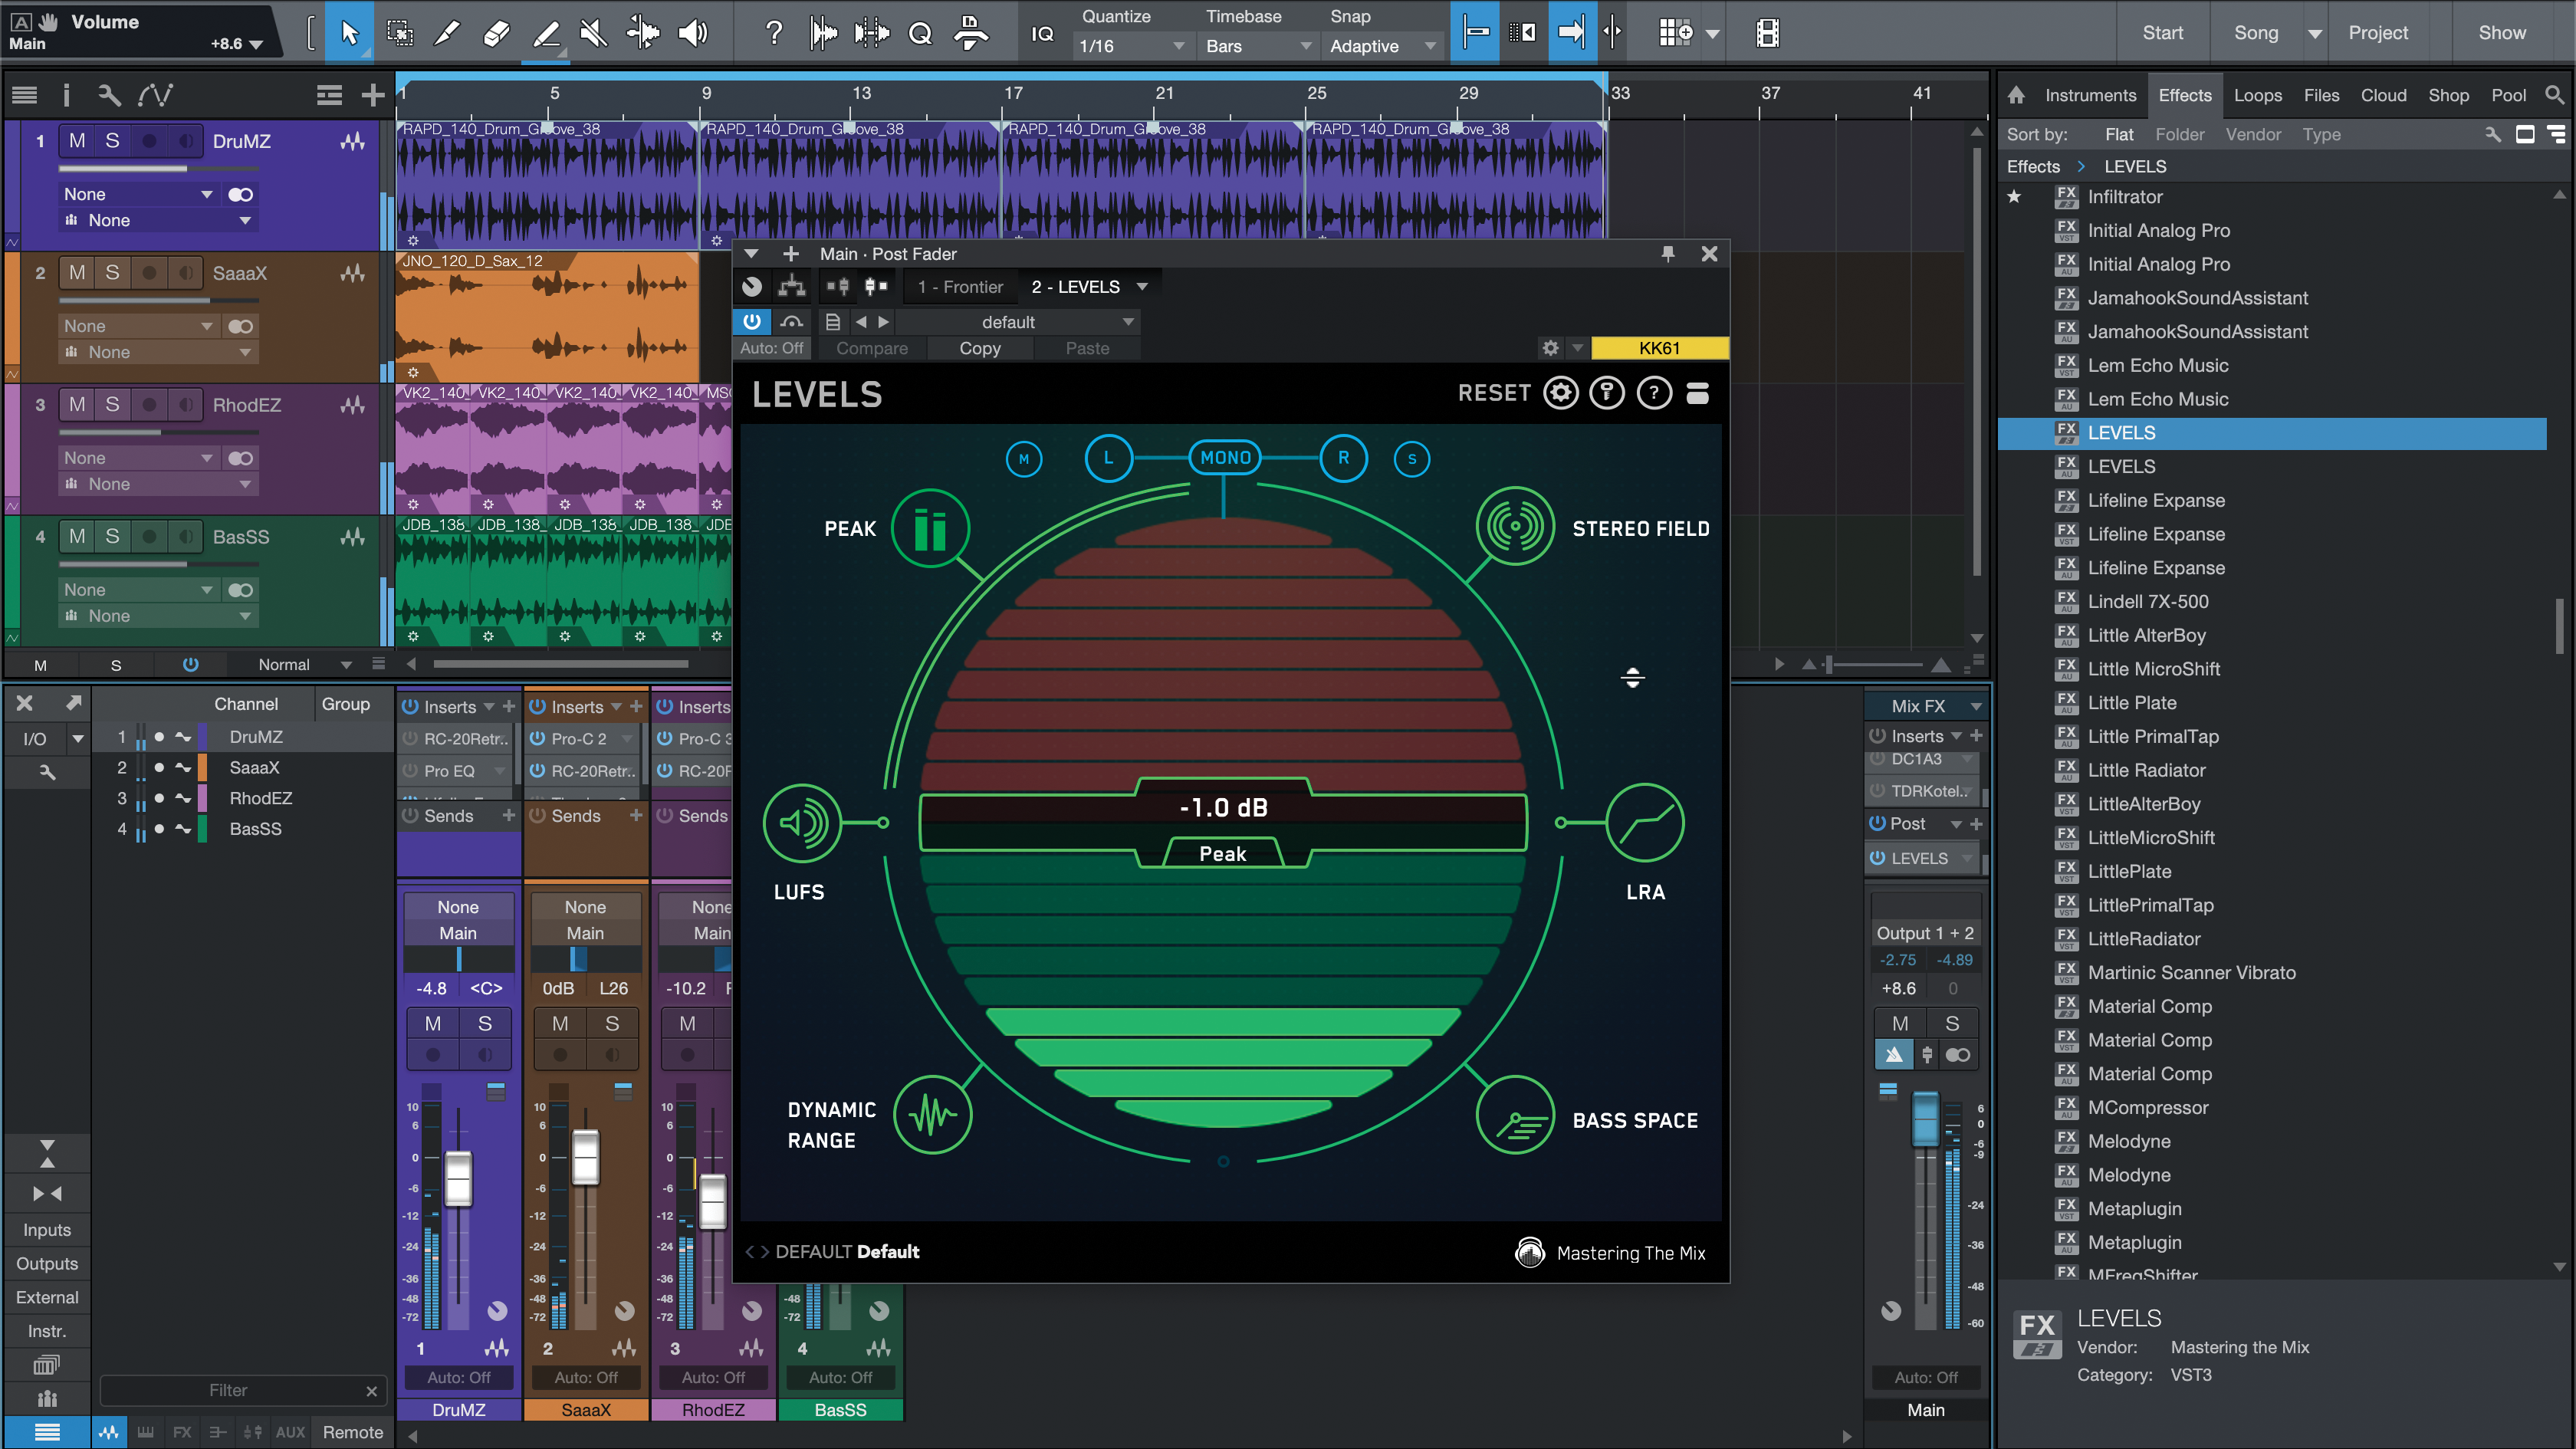
Step 2: As we play our music back for the first time, we can see from the icons around the circle whether our track is shaping up at different times, or whether there are some issues. We’ll head first for the Peak detector, which shows us that the mix is peaking at a nice, safe -1.0dB… or is it?
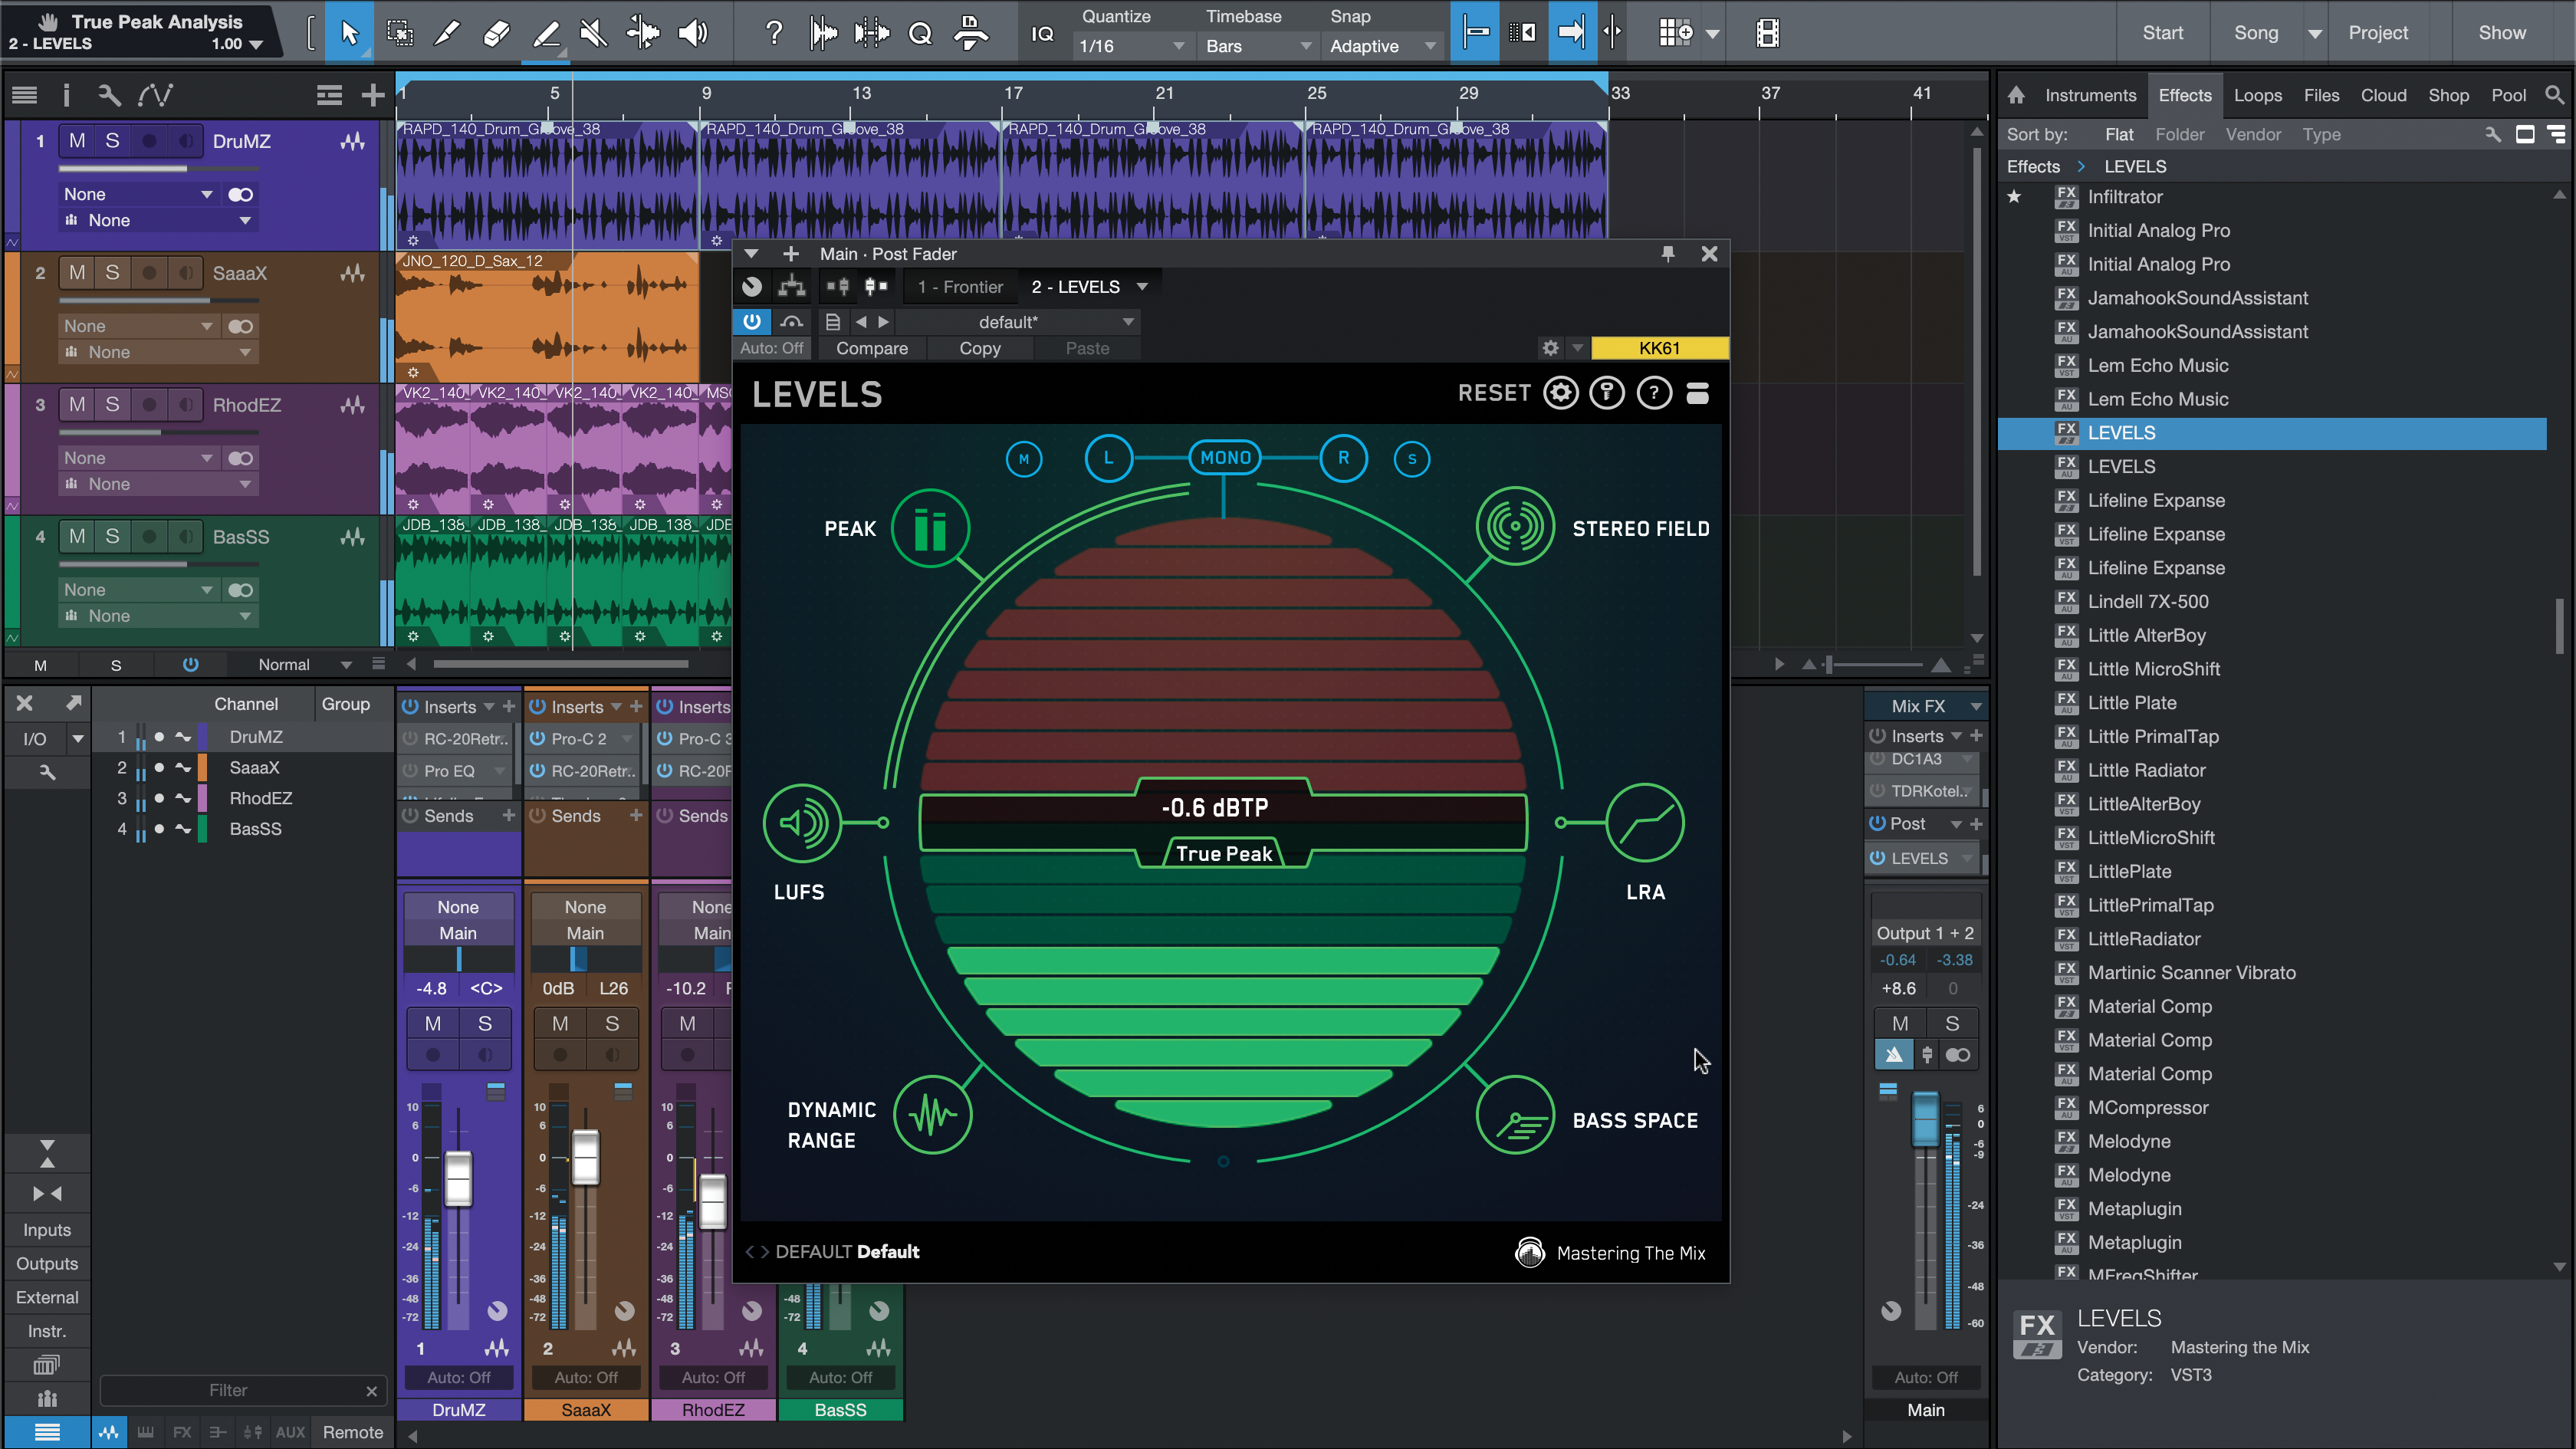
Step 3: By switching to True Peak mode, we see that the signal is really peaking at -0.6 True Peak, which would usually cause it to be turned down until it reaches the desired -1.0. We can use this knowledge to reduce our transient levels, while leaving other, average-loudness-causing elements intact.
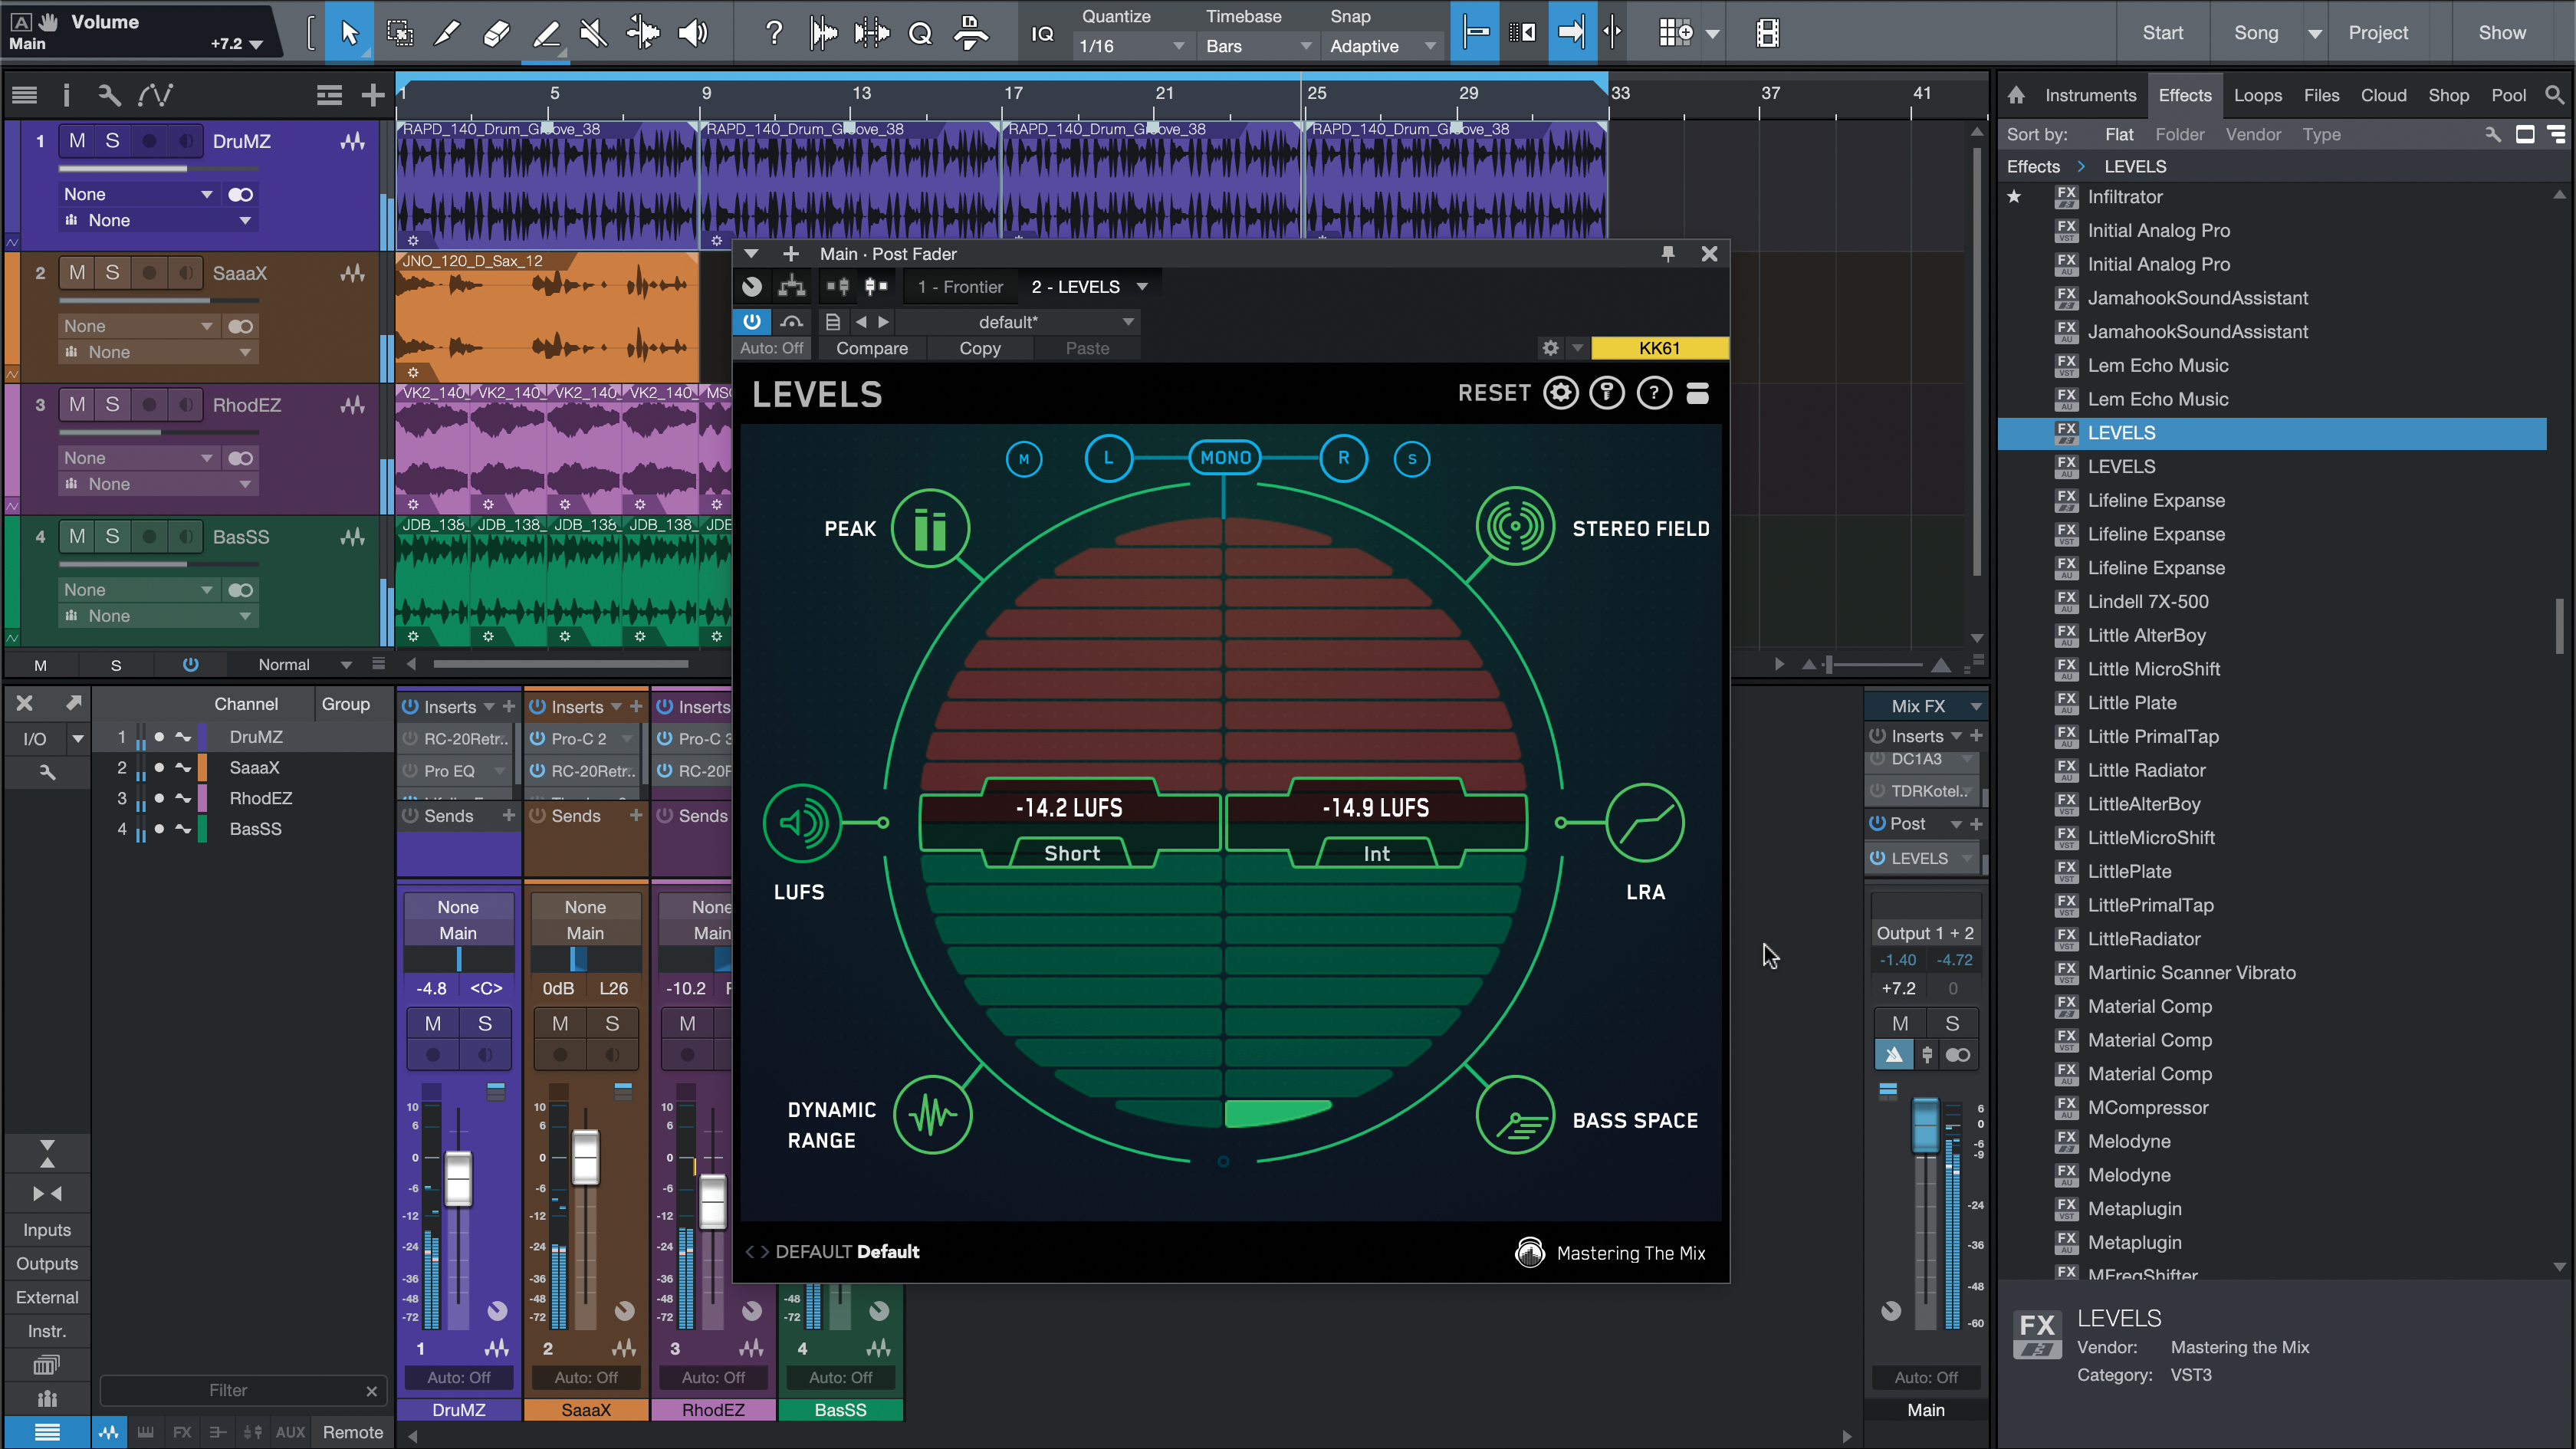
Step 4: Now onto the other crucial part: the LUFS meter. Our track’s Short reading (about a 3-second window) doesn’t tickle the meter, hovering between -15 and -13 LUFS. This level is actually ideal, and would lead the track to sail through any streaming checks quite unharmed.
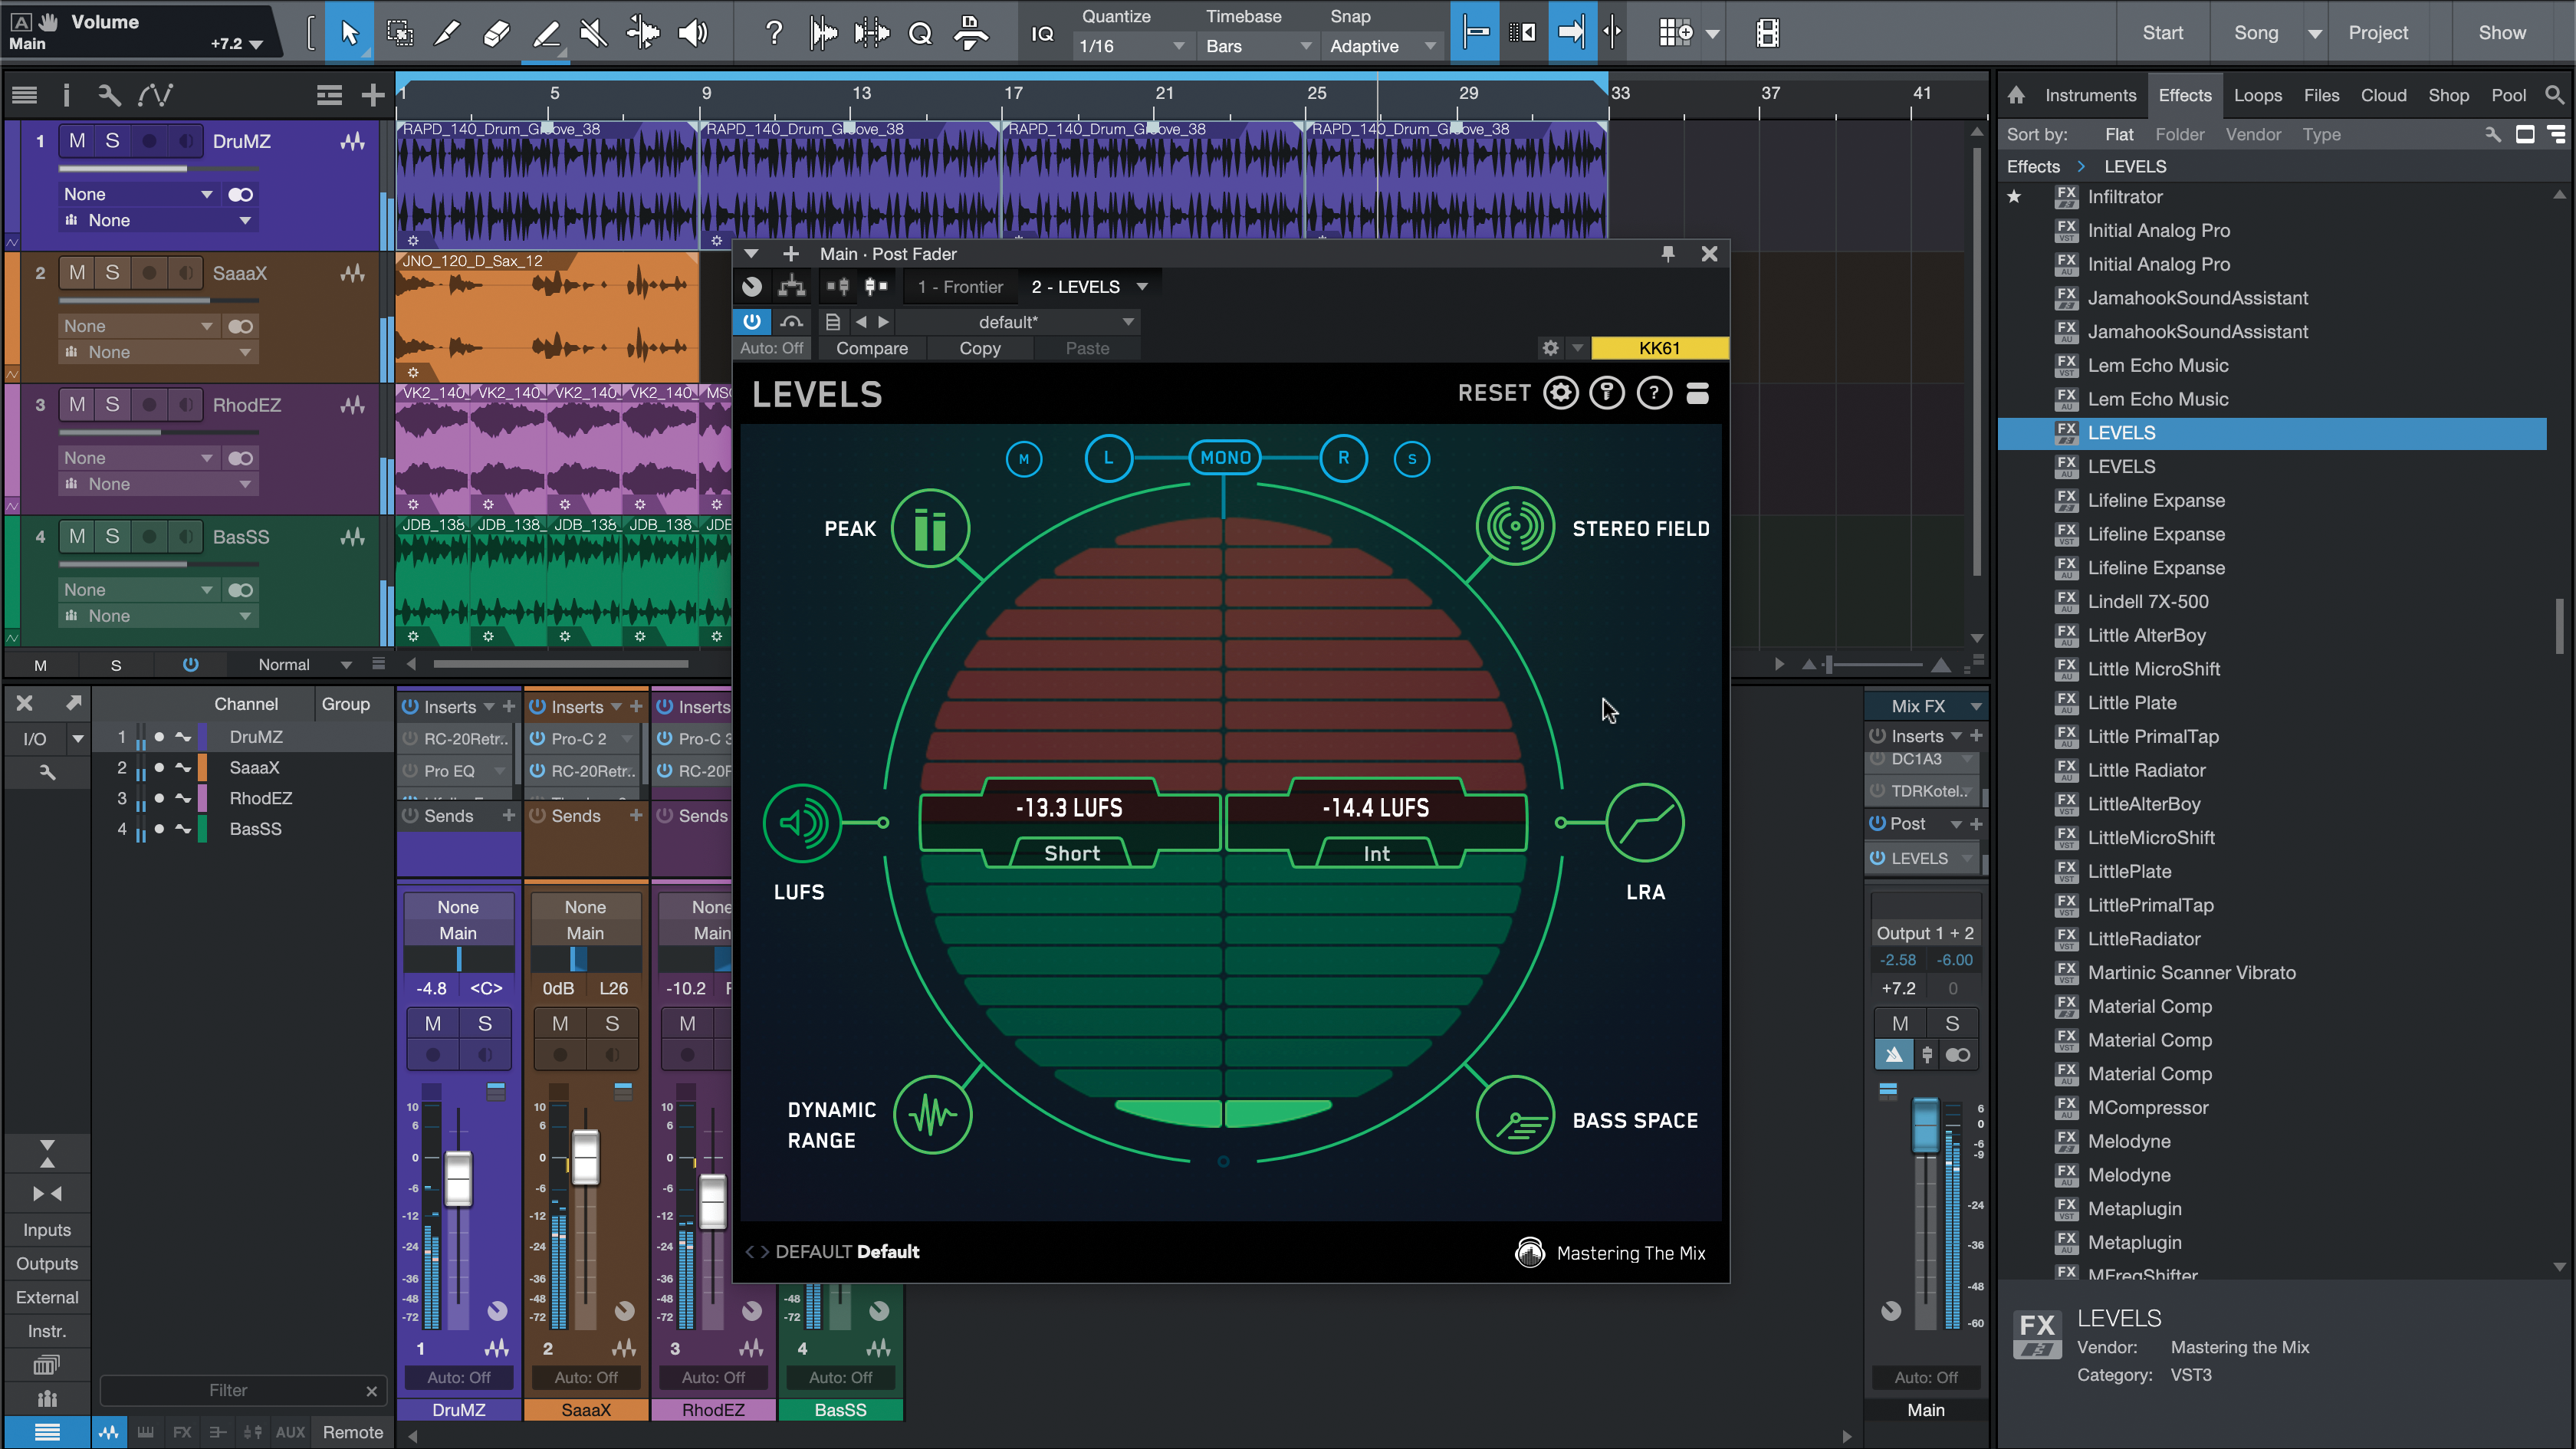
Step 5: The Integrated reading for Levels’ LUFS metering will give you an idea of the LUFS reading throughout the entire track. This can help get a decent reading, especially if the material from the start to the finish of the track varies heavily in its loudness.
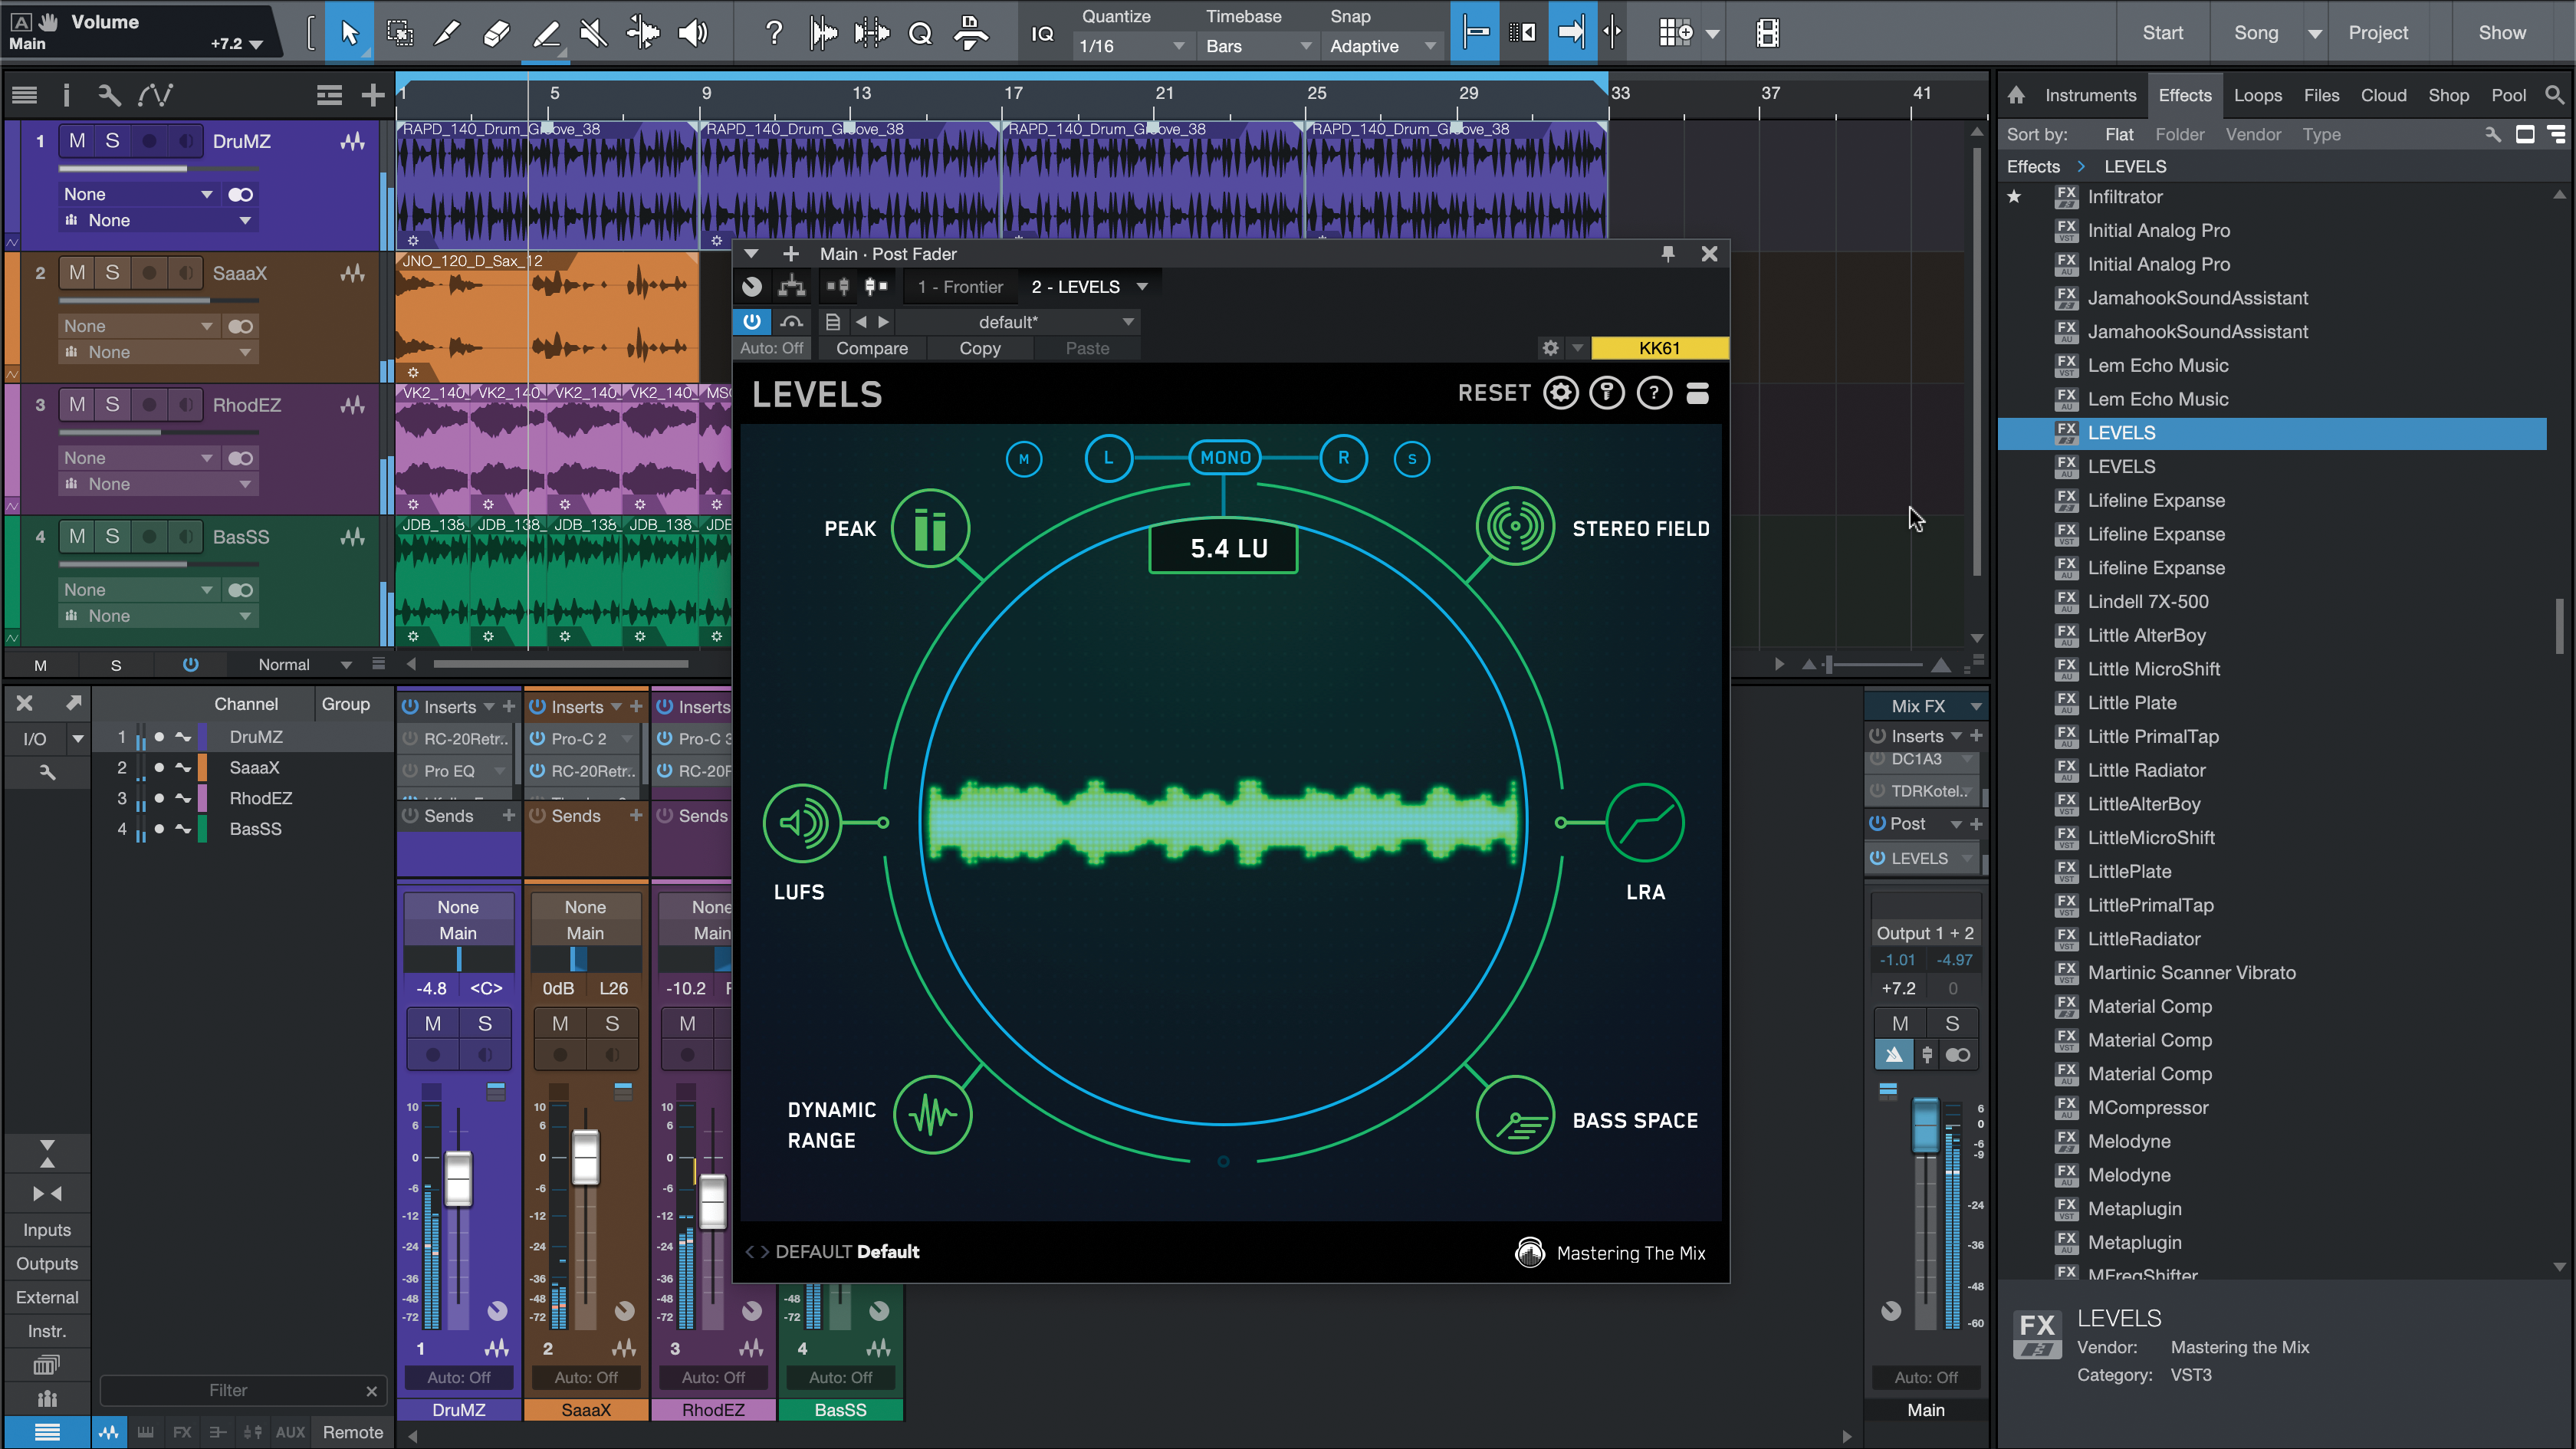
Step 6: The LRA of a track tells you the difference in loudness between its loudest and quietest parts. Something to keep in mind, knowing that your loudest part will likely be the one that’s calibrated to the target loudness of each streaming service, and the quieter parts could end up too quiet.
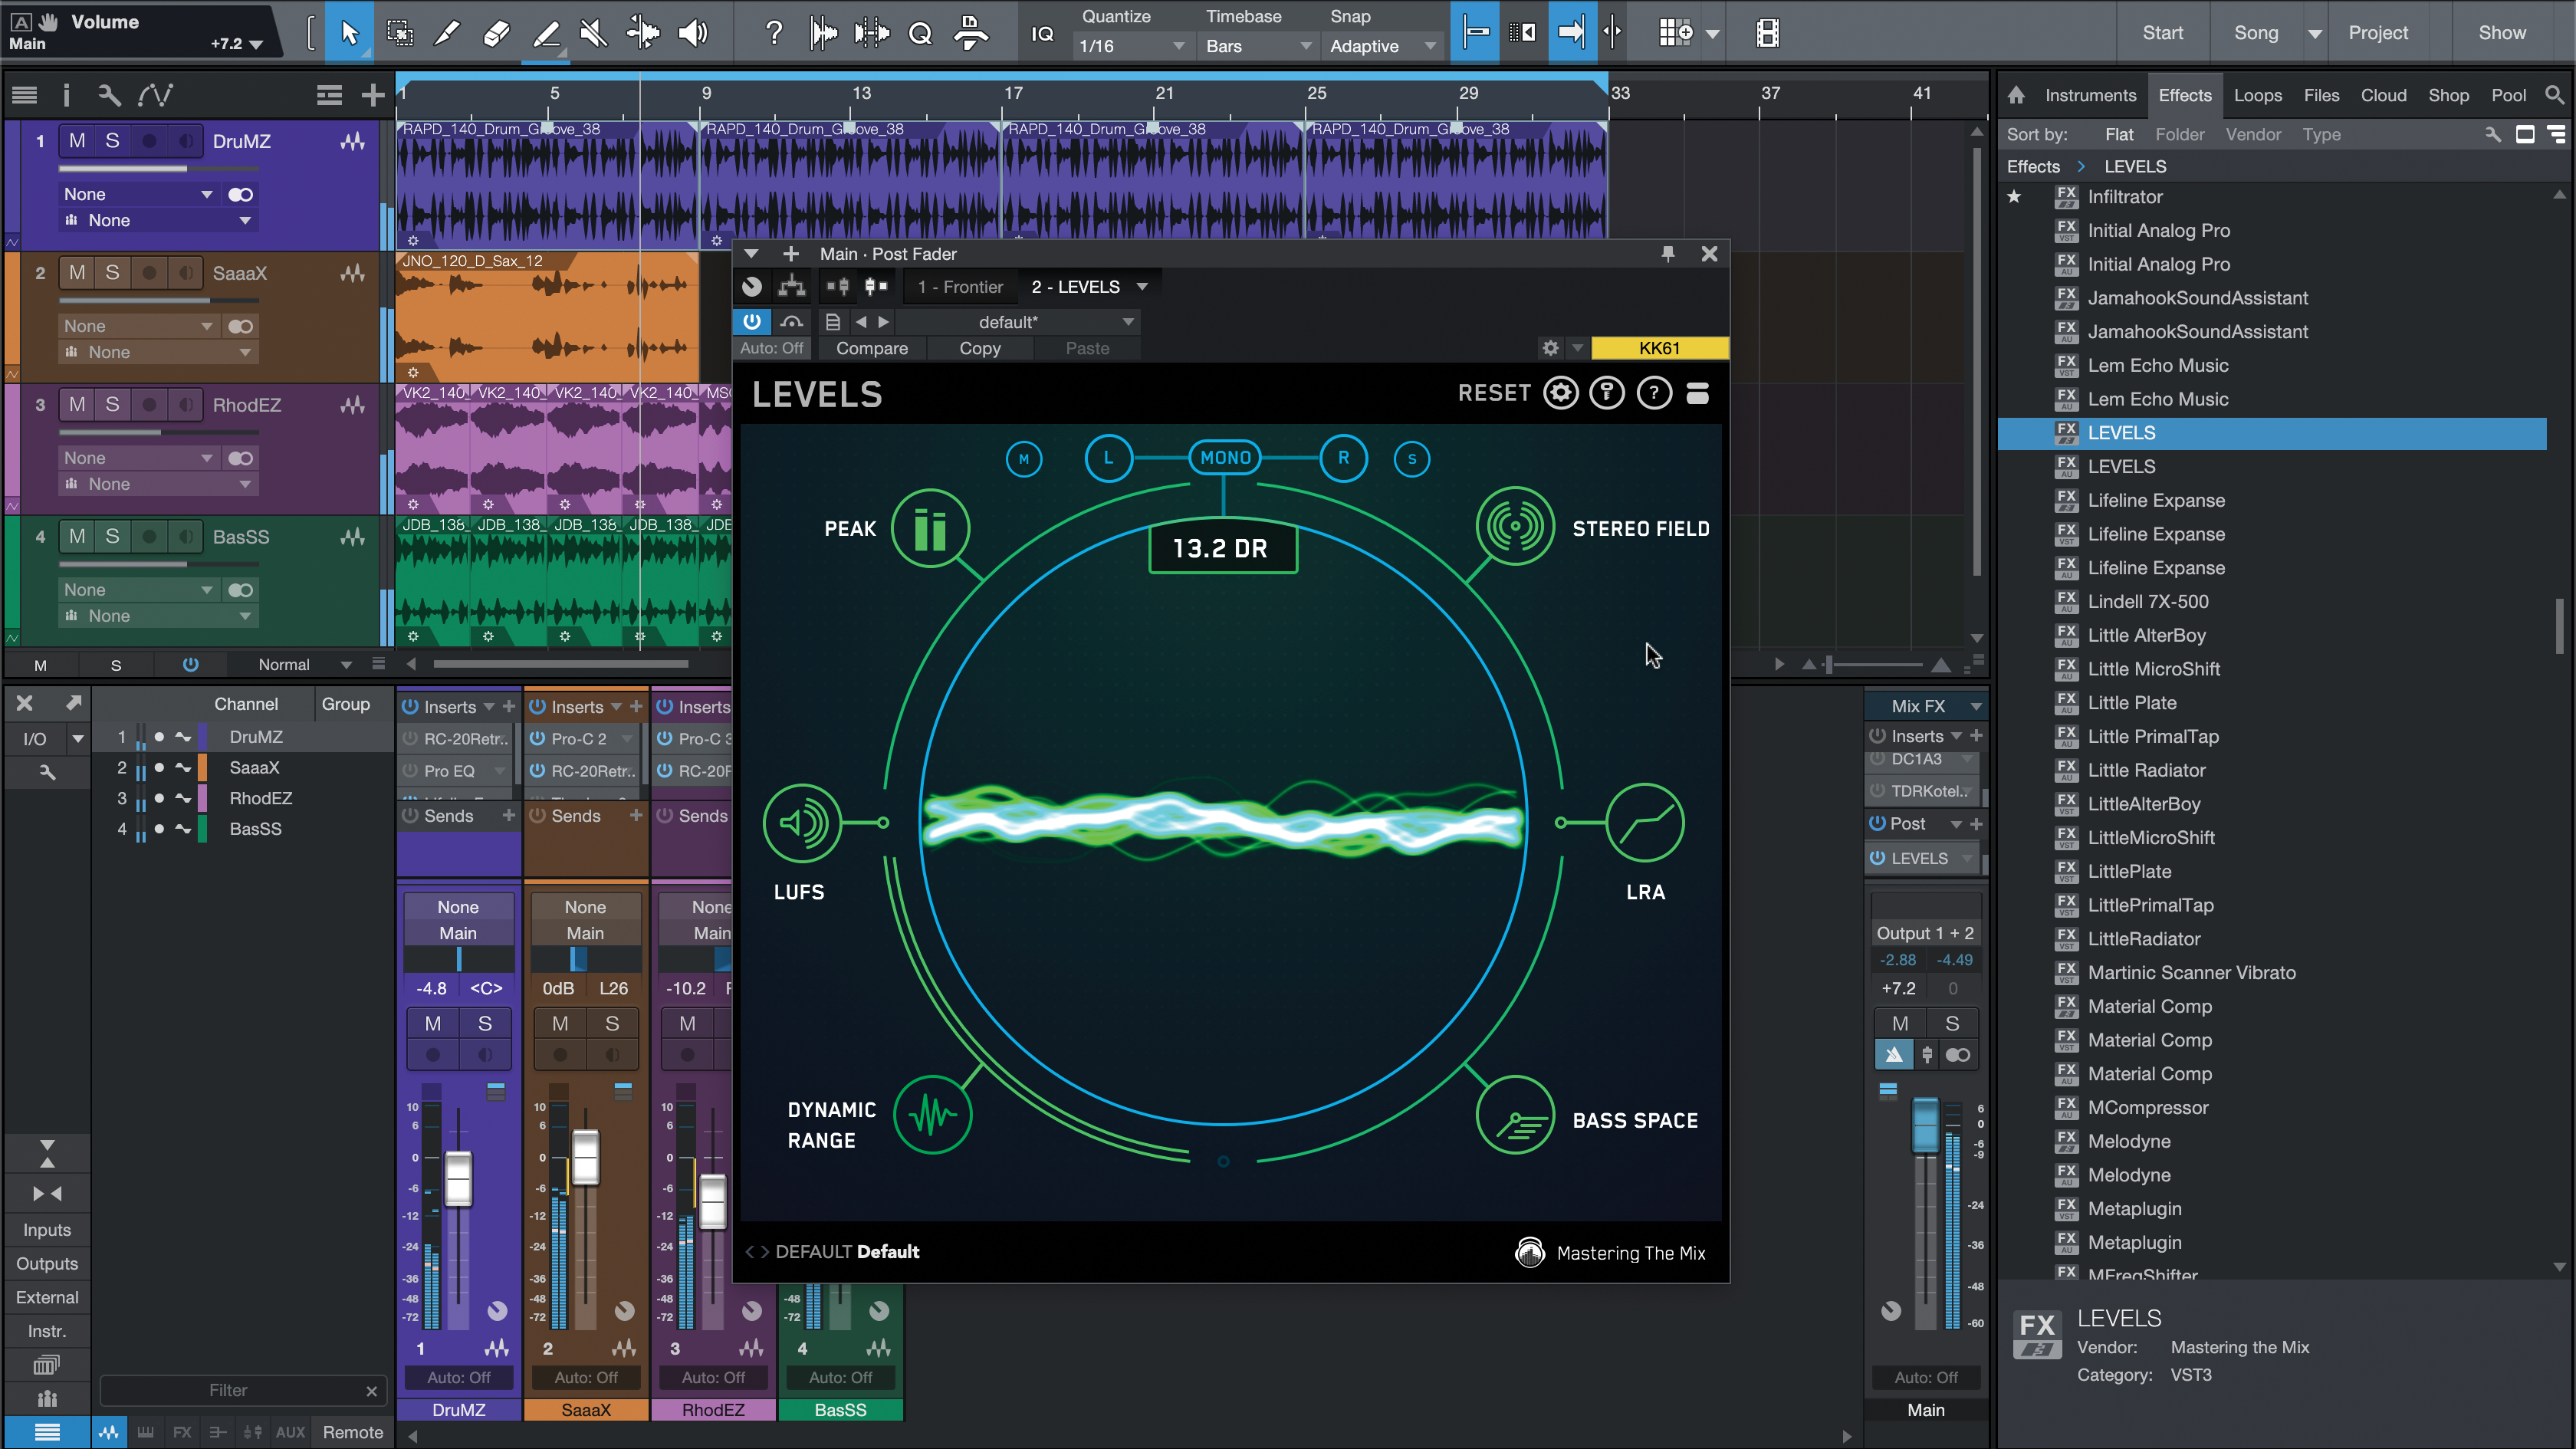
Step 7: Dynamic range may not seem to be as important as it was now that we’re in a world of LUFS, but the same guidelines as ever should apply: squeeze your track too much, regardless of the measure loudness, and transients will lose clarity.
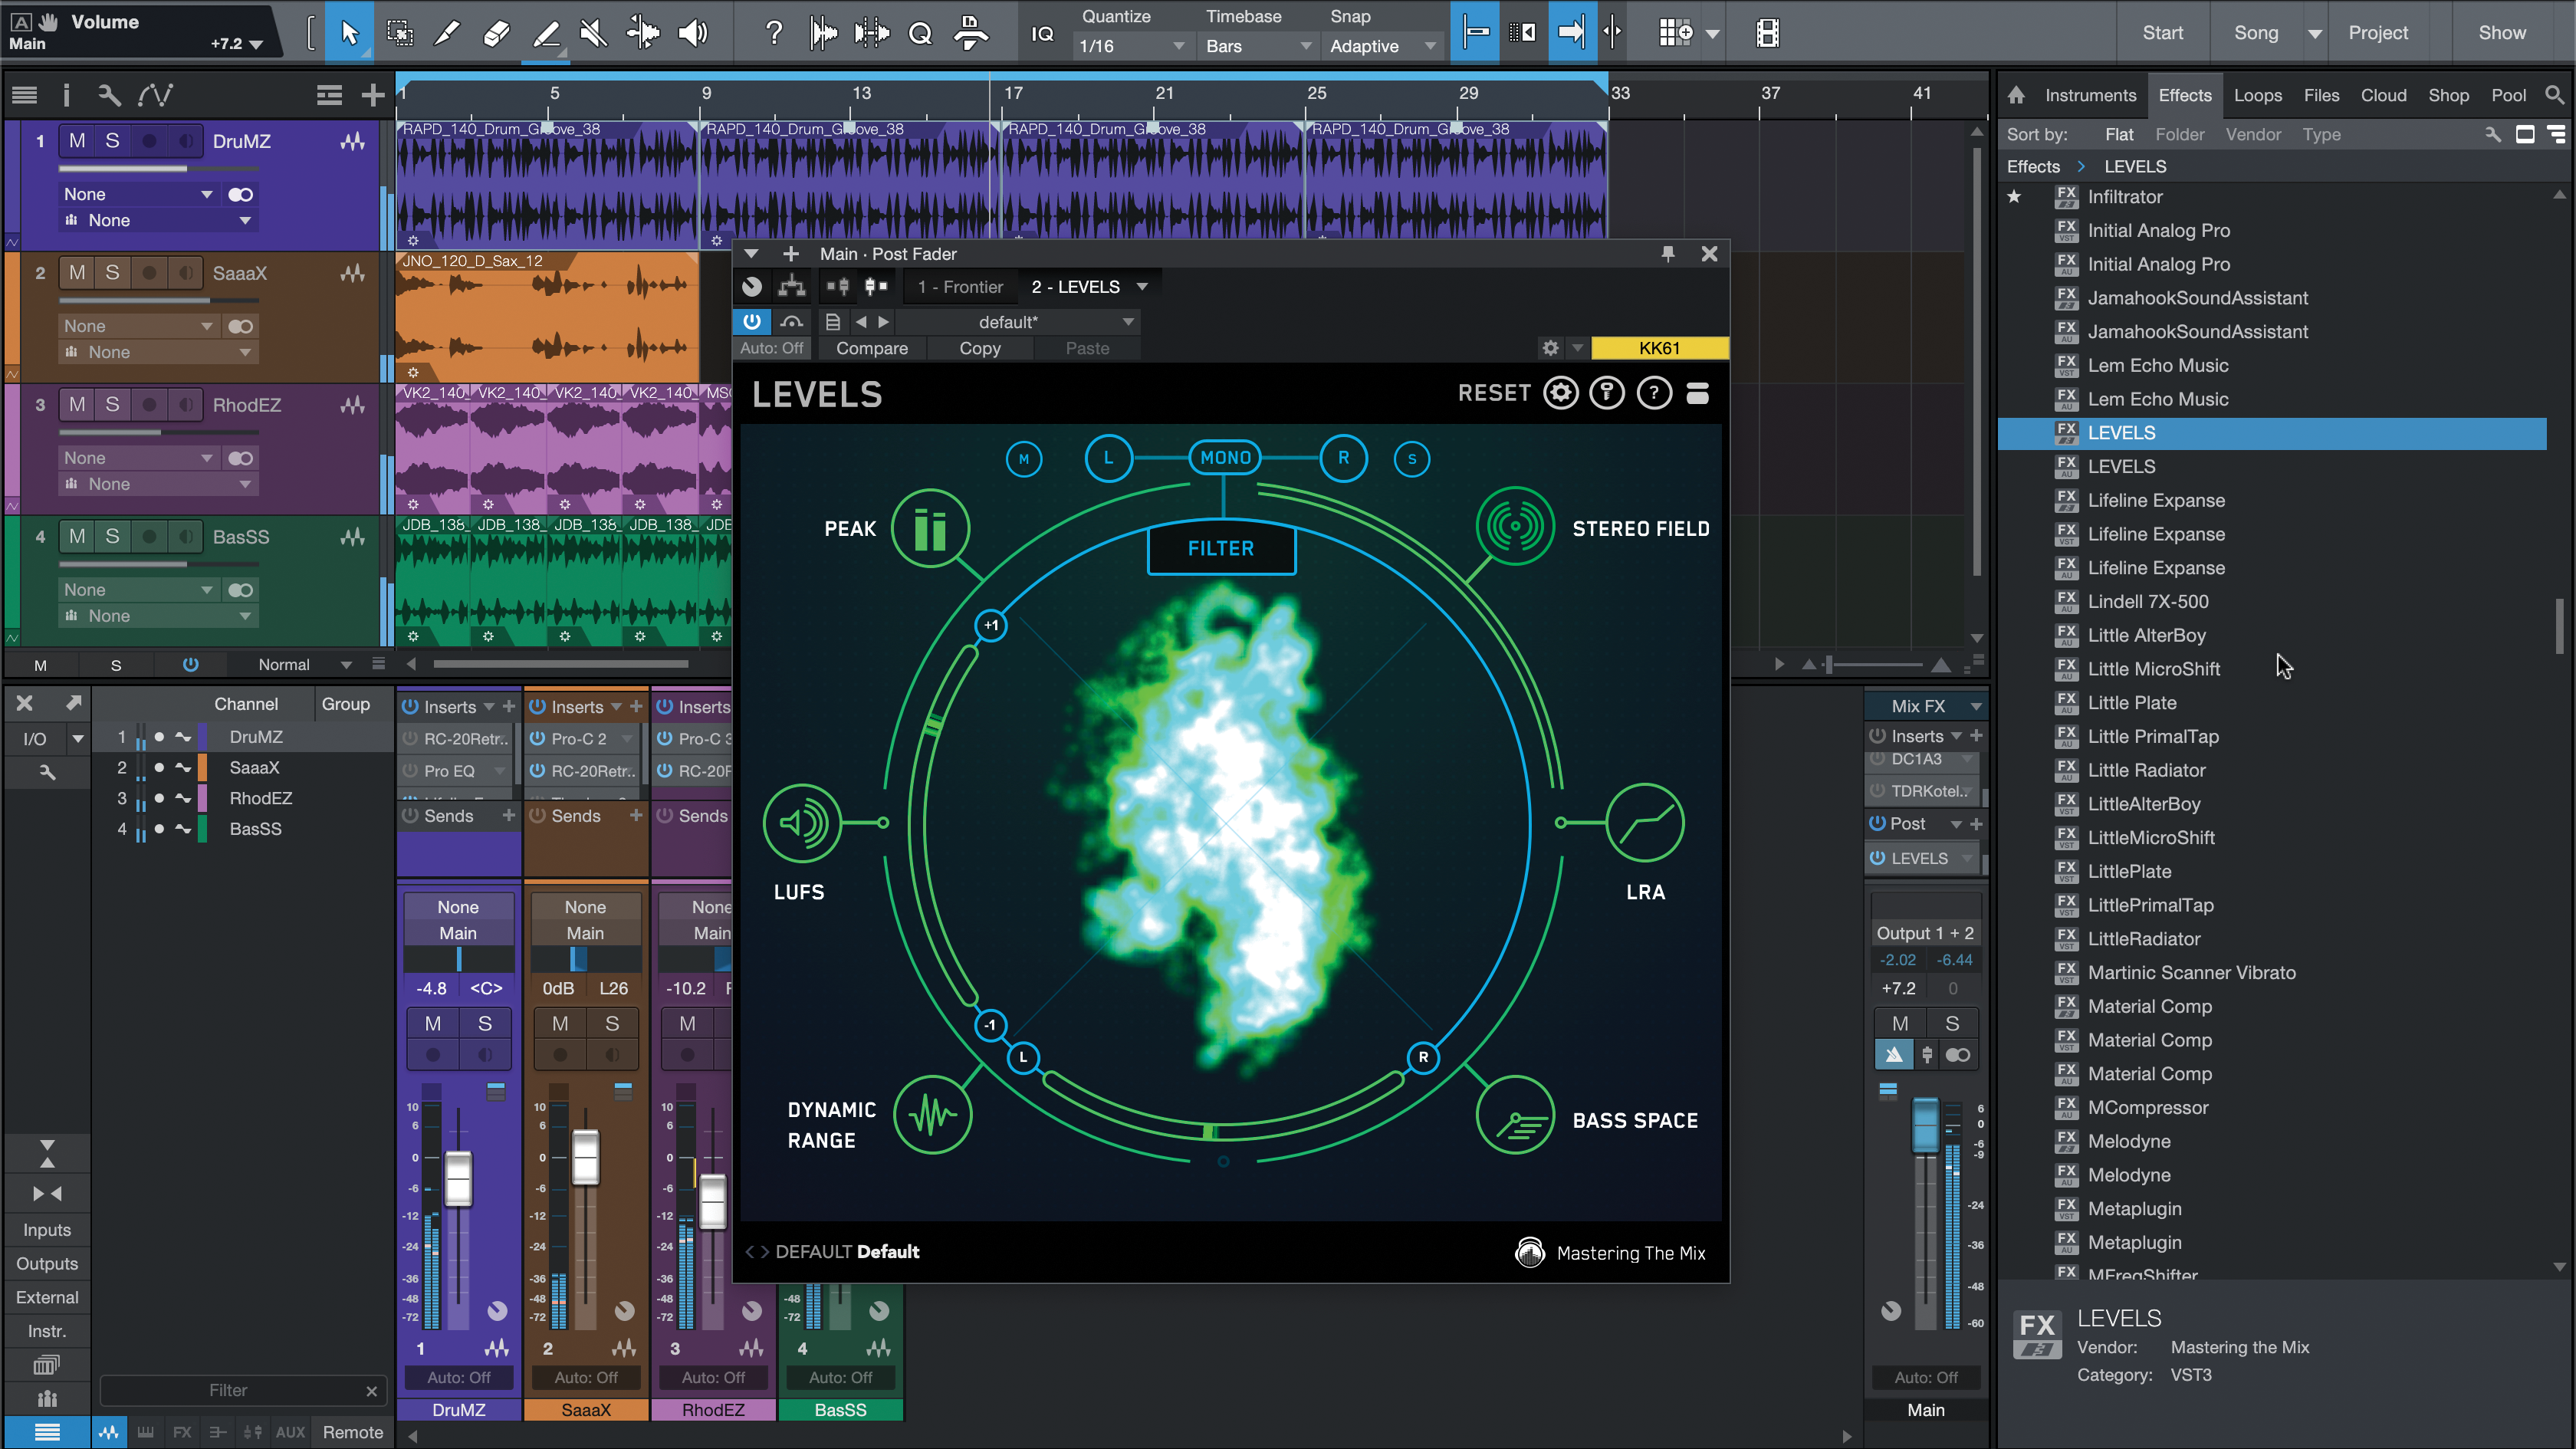
Step 8: Although the final two processors of Levels aren’t necessarily anything to do with loudness as measured, they can still help at this stage. Stereo Field measures width, and phase coherence, and lets you apply low and high filters to mono the tops or bottoms of your track.
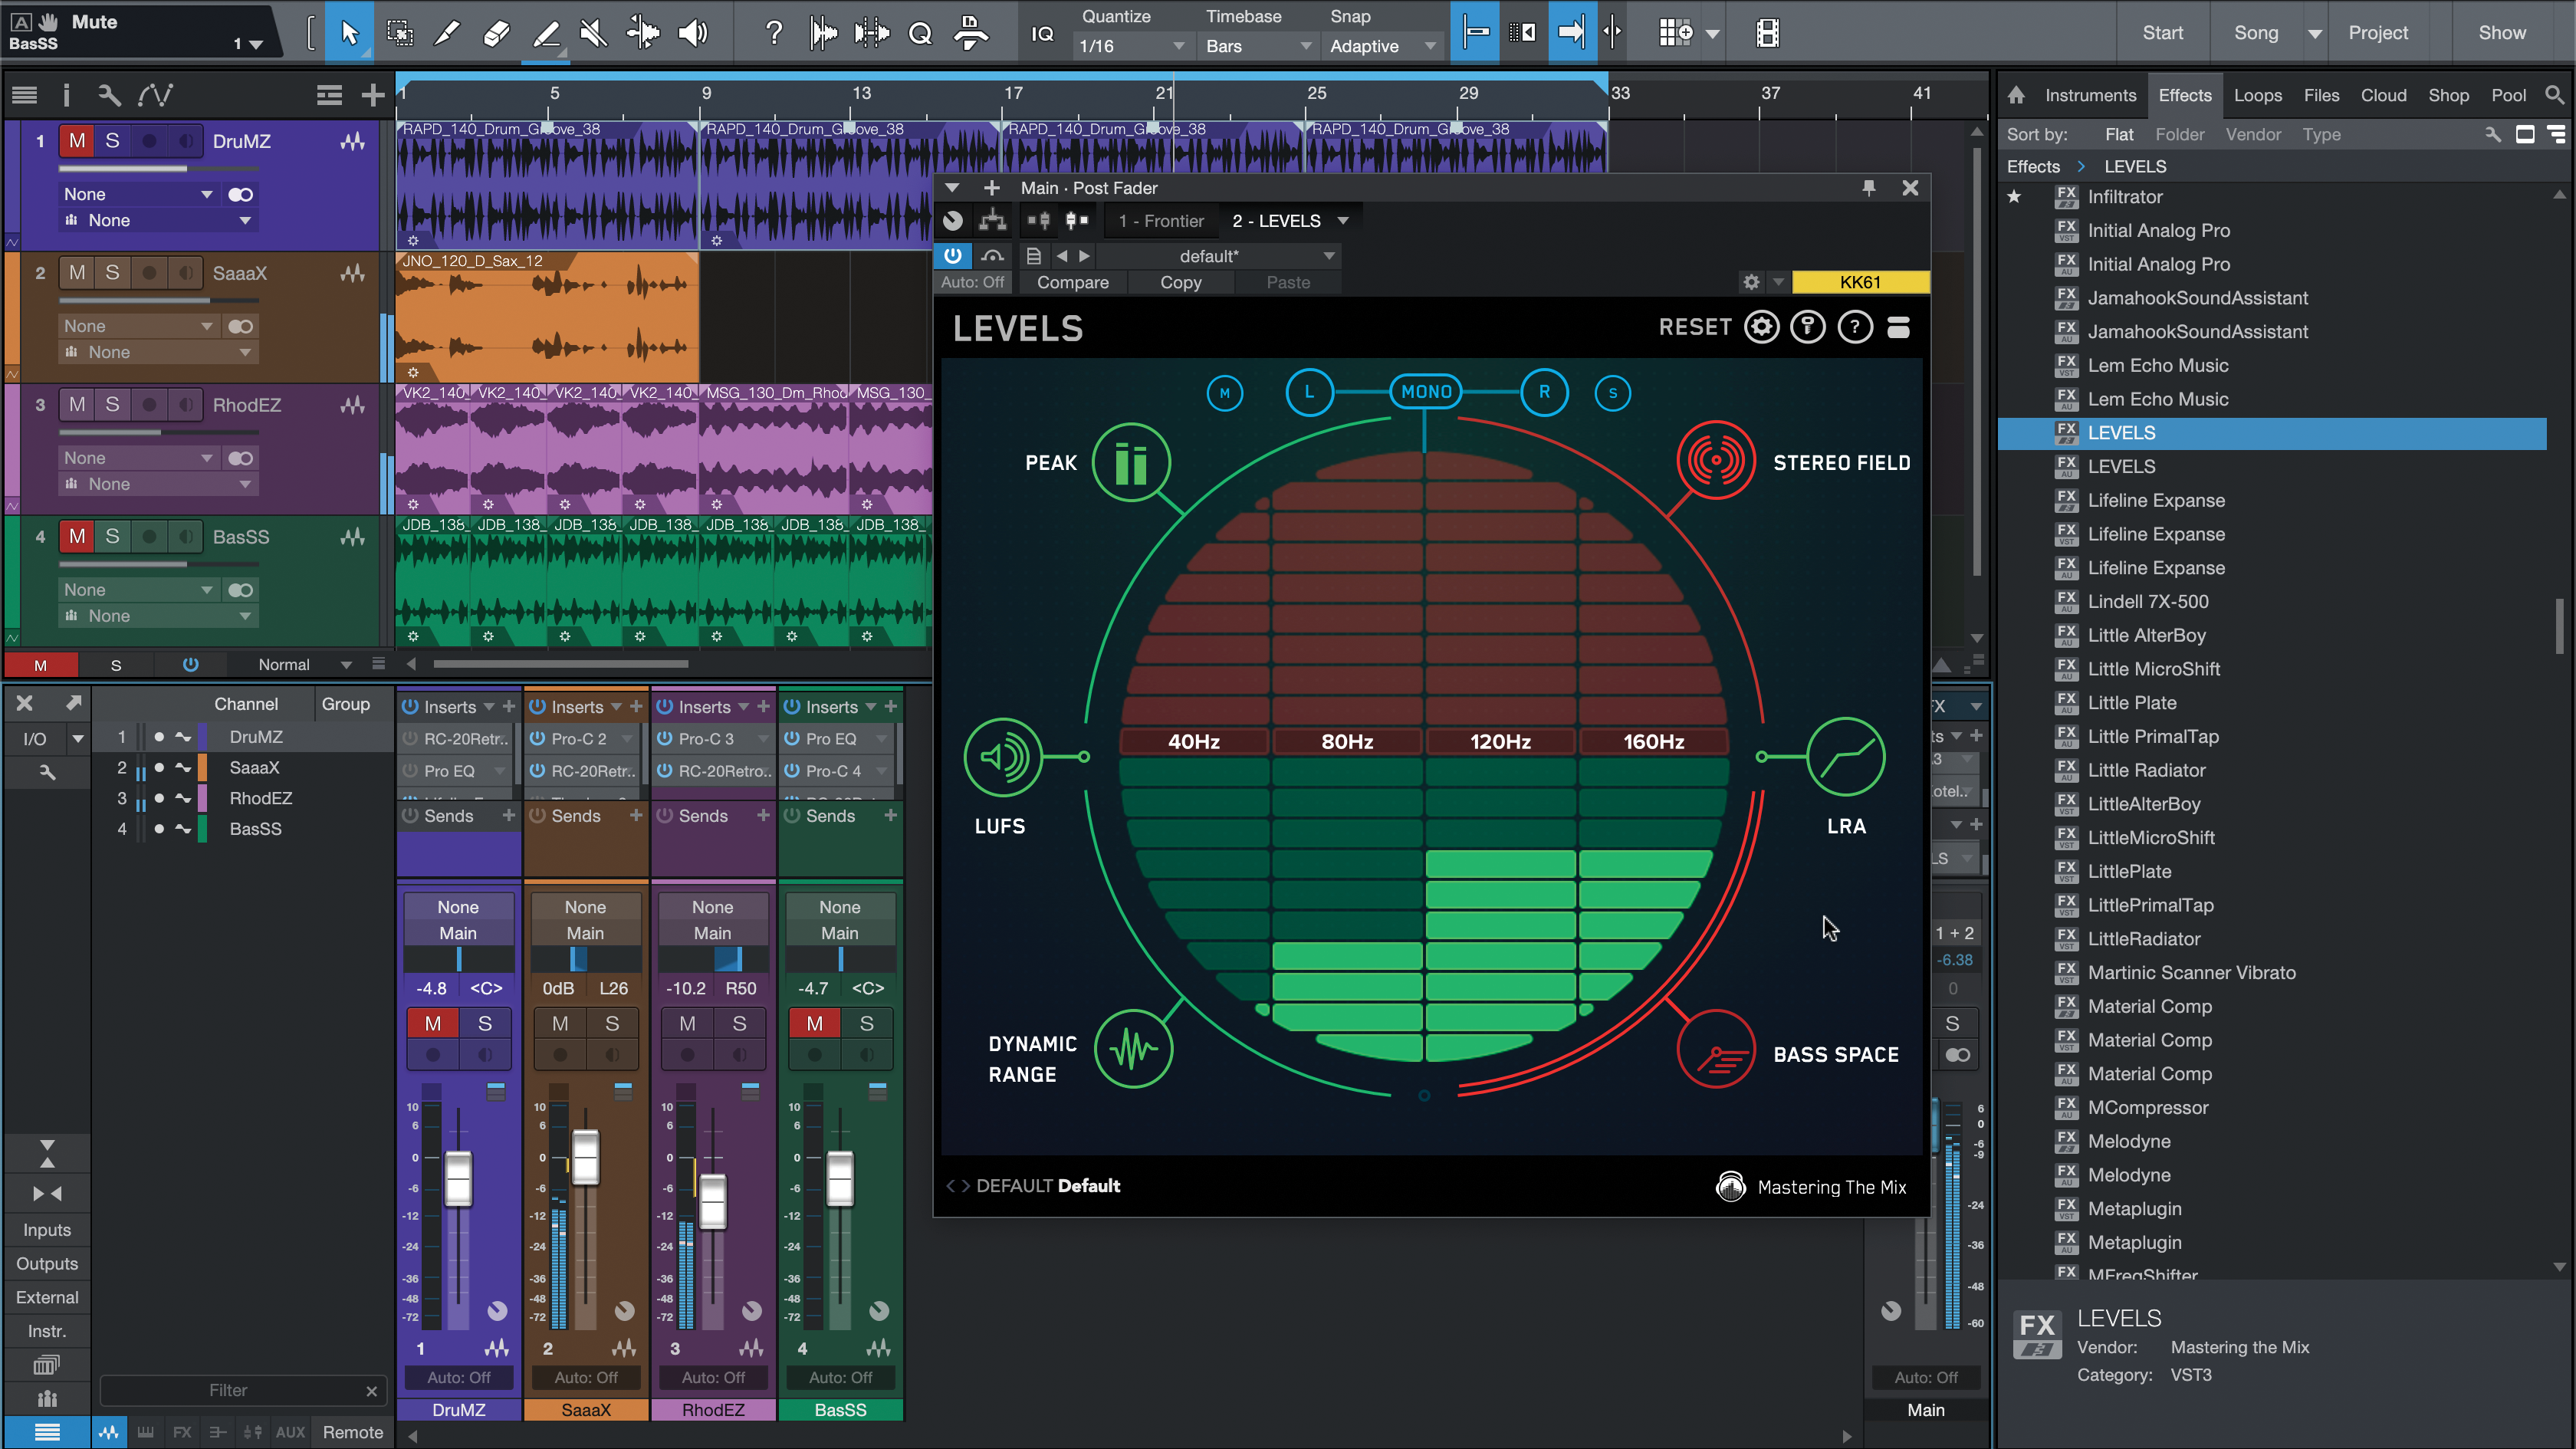
Step 9: Bass Space, meanwhile, gives some insight on whether the higher track elements leave enough room for the kick and bass. You mute these two elements before doing the analysis. This knocks our Stereo Field reading out for the moment, but it’ll come back with the full mix.
Three modern mastering tools
1. Mastering The Mix Levels
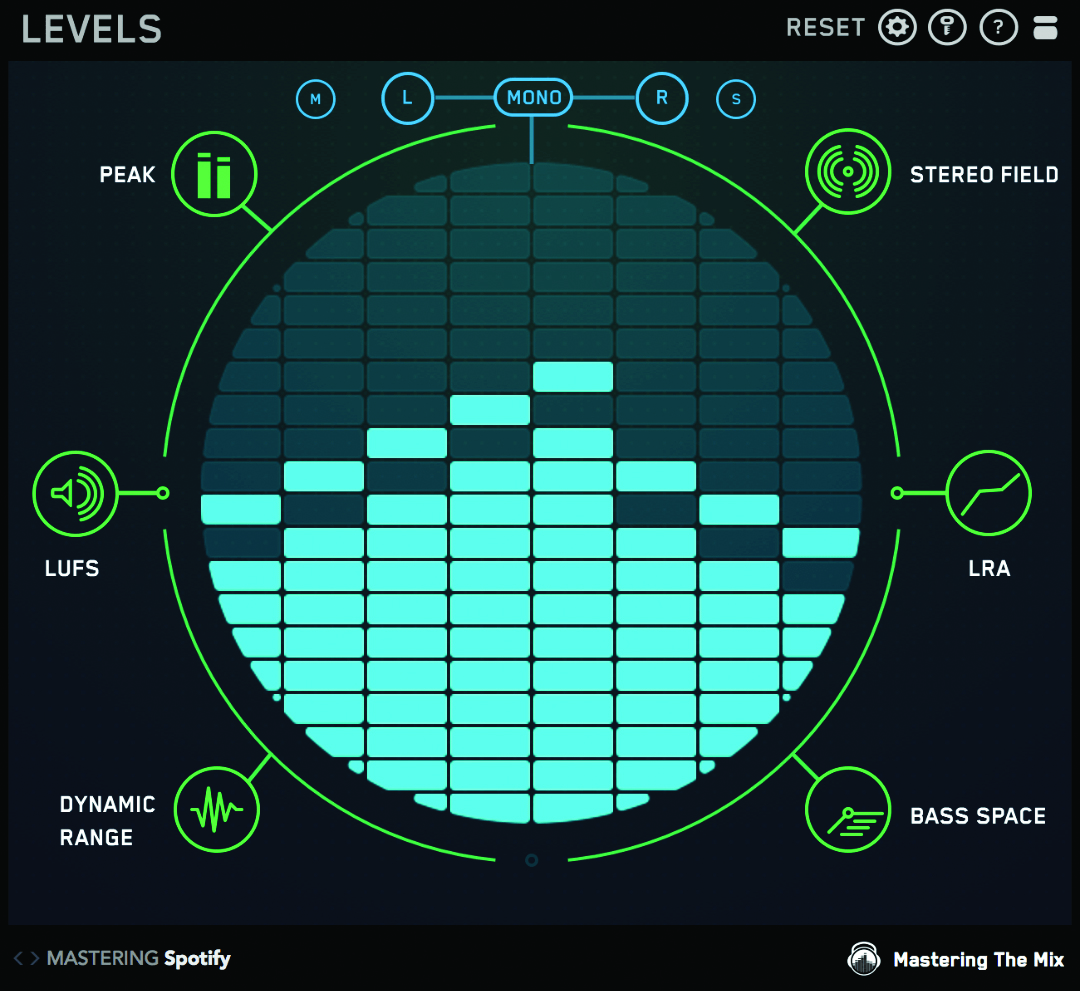
A simple way to gauge whether your mix or master is hitting various commercial targets or not, Levels puts several properties around its central display, and turns each icon green or red, depending on how it’s going. If you’re not measuring up in any area, you can get more info on why in the central readout.
2. Youlean Loudness Meter 2
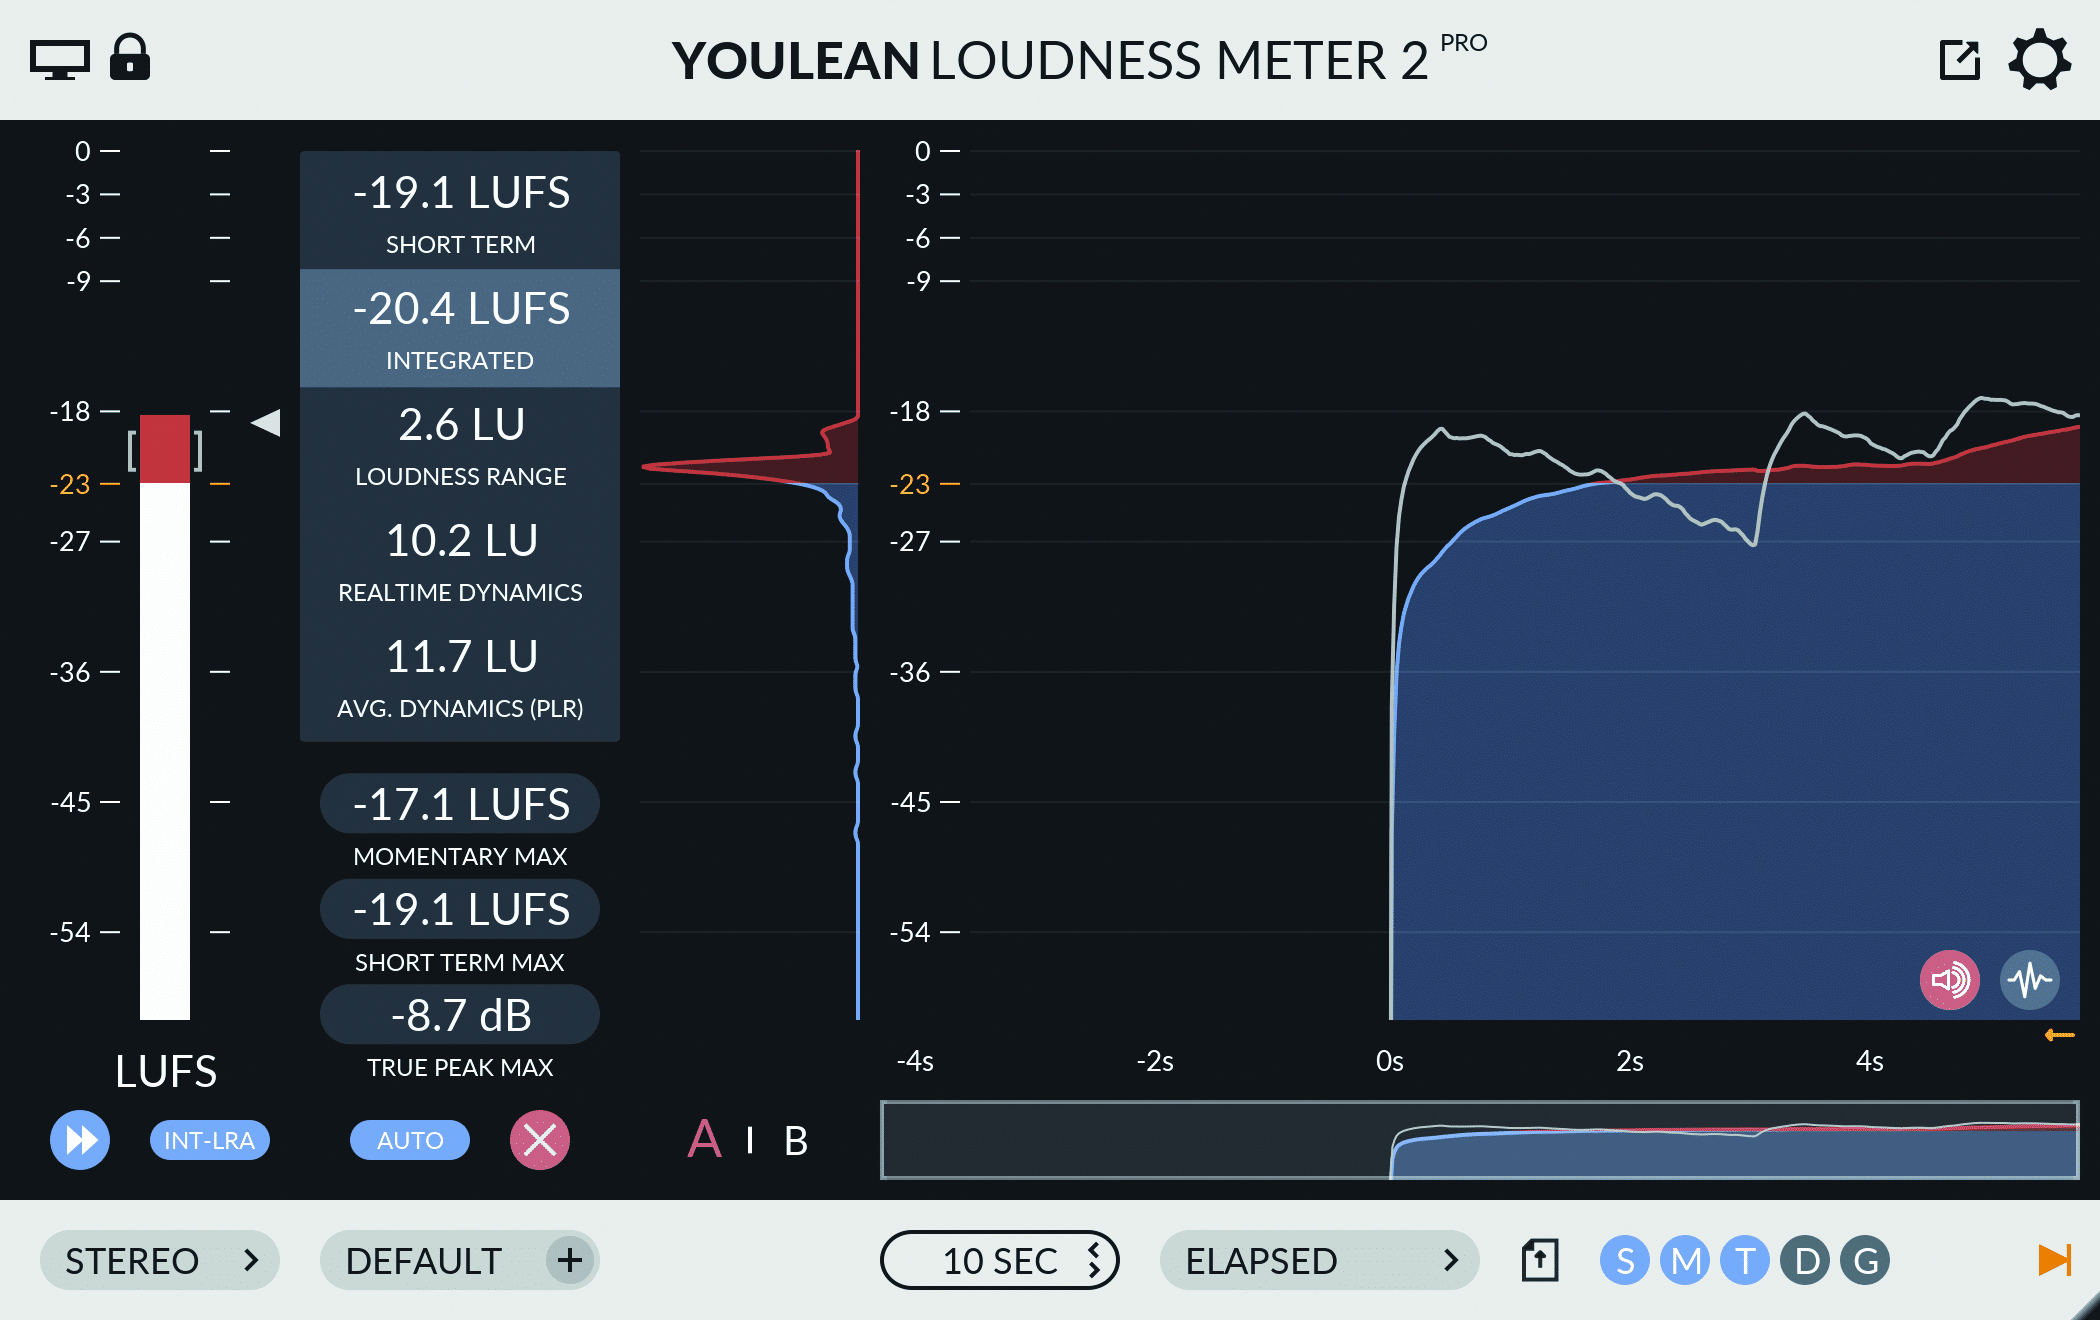
One of the first great solutions to interrogating your mix as to its LU and True Peak, as well as other properties. Get the free version of Youlean’s Loudness Meter, or plump for the pro.
3. MeterPlugs Loudness Penalty
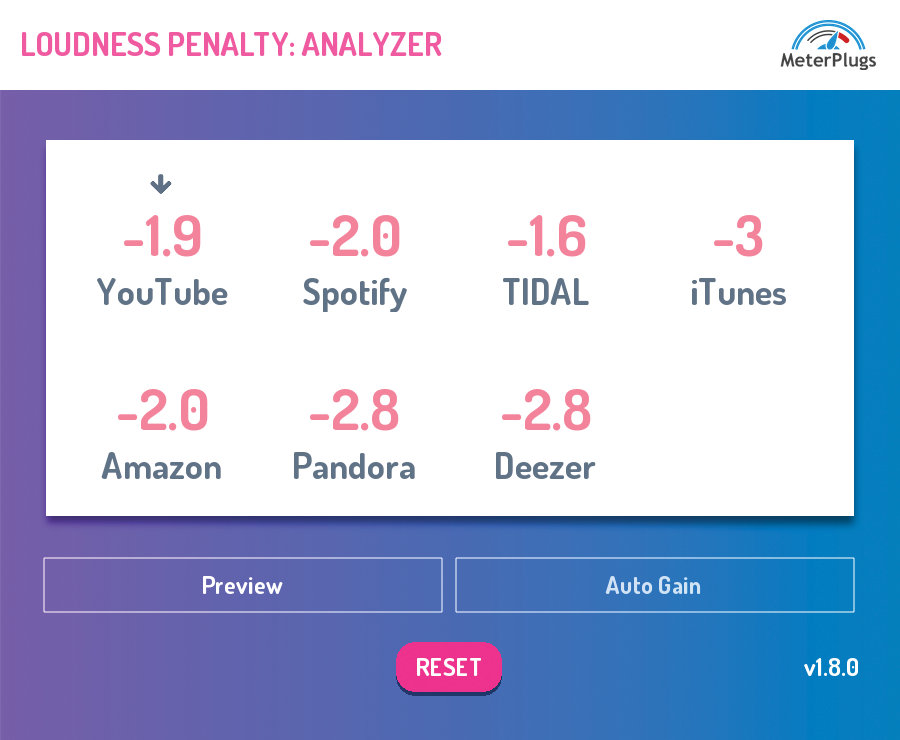
Get a semi-instant recommendation on how much the different streaming services will turn down your track. Loudness Penalty analyses your current work and also keeps track of changing standards.

Future Music is the number one magazine for today's producers. Packed with technique and technology we'll help you make great new music. All-access artist interviews, in-depth gear reviews, essential production tutorials and much more. Every marvellous monthly edition features reliable reviews of the latest and greatest hardware and software technology and techniques, unparalleled advice, in-depth interviews, sensational free samples and so much more to improve the experience and outcome of your music-making.
