"What's the secret to making a hit record?": This free plugin promises to measure the commercial appeal of your mix - but does it work?
Airwindows says the Hit Record Meter can measure the "hit-record-ness" of your track. Is the plugin a hit or a flop?
What is the secret to making a hit record? Is it the melody and harmony of the music? The rhythm and tempo? The instrumentation? Whether the artist wears the right clothes?
All of these factors have a part to play but, according to Chris Johnson of Airwindows, these elements (apart from the clothes) feed into something measurable that reveals the secret to producing hit records. If something can be measured, then it stands to reason that it can be visualised, and this is exactly what Hit Record Meter does.
OK – great – so all we have to do is add the plugin to our master buss, tweak the mix until it says "It's a hit!", and then sit back and watch the money roll in?
Despite allusions to the contrary, the plugin does not actually judge whether your mix will be a hit
Sadly not. Despite allusions to the contrary, the plugin does not actually judge whether your mix will be a hit. Rather, it reveals hidden sonic details, plotting these across three rows of a rolling readout. Chris' assertion is that music with a "hit sound" will create certain patterns within the readouts, but his evidence for this is that these patterns are created by the recordings he most admires.
So is this just a case of confirmation bias? Yes… and no!
There's certainly a degree of subjectivity at play here: There are plenty of hit records that don't create these "hit record" patterns, and various non-musical noises – a rain storm, or waves on a beach, for example – that do. Nevertheless, the plugin has an undeniable ability to recognise and reward a well-produced or attention-grabbing mix.
Measuring 'hit-ness'
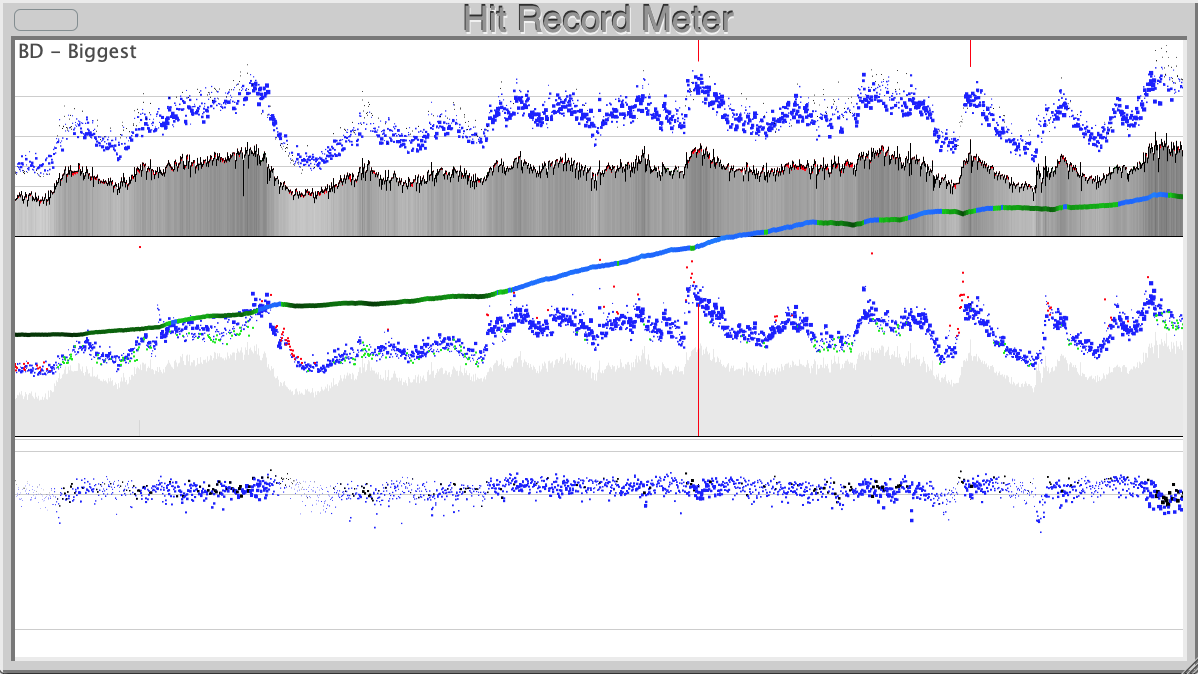
Hit Record Meter (let's call it HRM from here on) bases its visualisation on four key metrics: Peak level, RMS level, slew energy and zero-crossing rate. It performs various analyses on these metrics, plotting the results across three rows of readout, each representing a different aspect of the audio.
Get the MusicRadar Newsletter
Want all the hottest music and gear news, reviews, deals, features and more, direct to your inbox? Sign up here.
The top row shows the RMS level as a shaded area, indicating the dynamic density of the mix, and floating above this is a cloud of dots marking the signal peaks. The size of dot indicates how many such peaks occur over a short period, and the vertical position represents the amplitude averaged over the same short period.
When fed with a song that's been mixed and mastered to maximise loudness, the space above the RMS trace is narrower and the peak dots all fall within a more restricted band of amplitudes. Conversely, a track using less limiting and loudness pushing will tend to show a much wider area above the RMS trace, and the peak cloud will spread throughout this wider space. HRM judges the latter to have a better "hit sound" than the former.
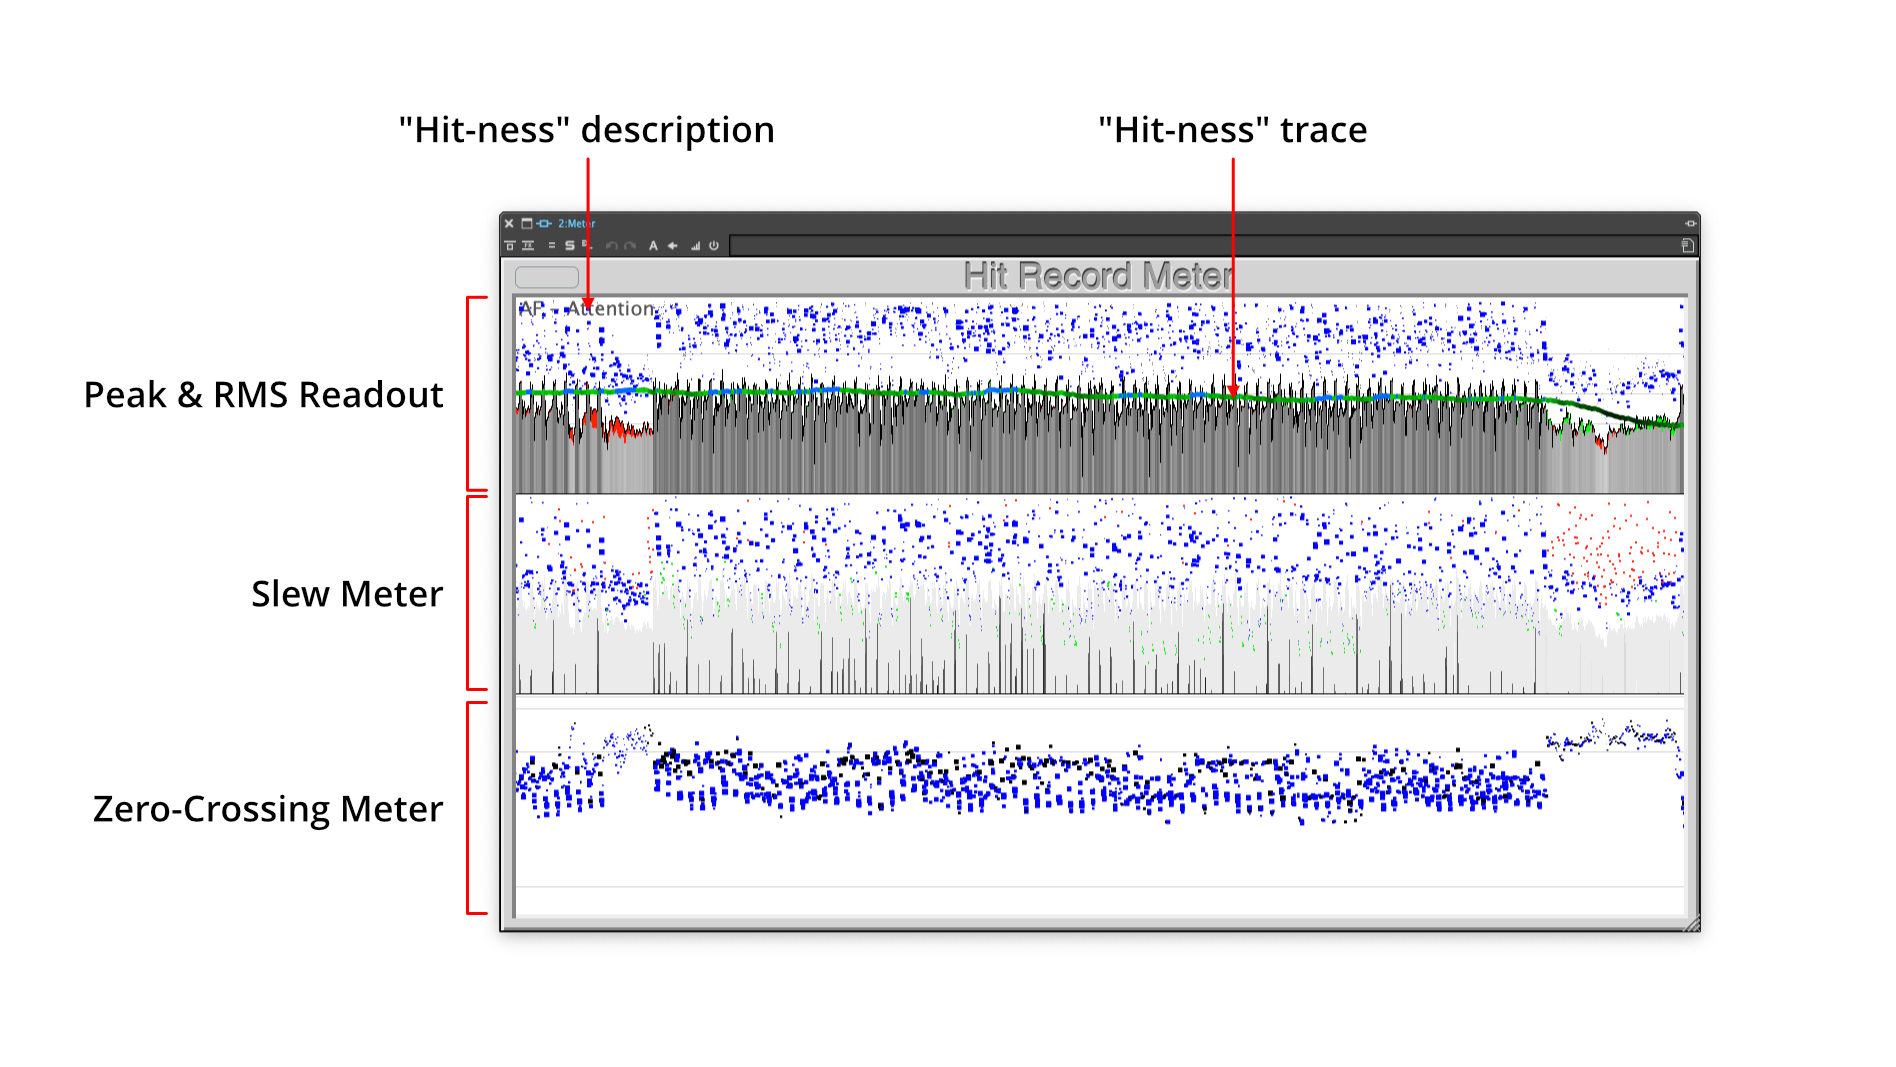
The middle row looks similar to the top row, with a shaded RMS area and cloud of dots, but here the dots are indicating slew energy, which may not be a familiar concept. A discussion of slew is outside the scope of this article, but in essence it's all about high-frequency detail and intensity.
The slew energy dots reveal where the most energetic events within the upper registers occur, as well as showing the actual frequency of those events. The density of the cloud indicates how bright or warm the sound is (denser is brighter, less dense means warmer), and the vertical spread shows the frequency around which that brightness is focussed. The plugin also detects overly-energetic high frequency events, marking these as grey spikes: the darker the spike the more overpowering those frequencies will sound, and the less HRM likes it.
HRM likes to see the strongest slew energy peaks aligning with signal peaks, resulting in blue dots, and for there to be a more diffuse cloud of less intense slew peaks within the spaces these blue dots. What it's really judging here, though, is whether your transients – snare hits, hi-hats, etc. – have brightness and presence, and whether your overall top-end is well balanced.
Our hearing is most sensitive within this range because it's also the range occupied by human speech, so we are hard-wired to find such frequencies attention-grabbing
The bottom row measures the number of zero-crossings that occur within a short period and, again, displays its results as a cloud of dots. The number of zero-crossings gives an indication of harmonic complexity, which is something we like to hear (proof: we find the sound of a saw wave more interesting than that of a sine wave). It also reveals a core frequency band for the audio – that is, a frequency range in which the audio is doing its most work.
For a good "hit-ness" score, this band should lie within the mid-range, and here at least there can be few accusations of bias. Our hearing is most sensitive within this range because it's also the range occupied by human speech, so we are hard-wired to find such frequencies attention-grabbing.
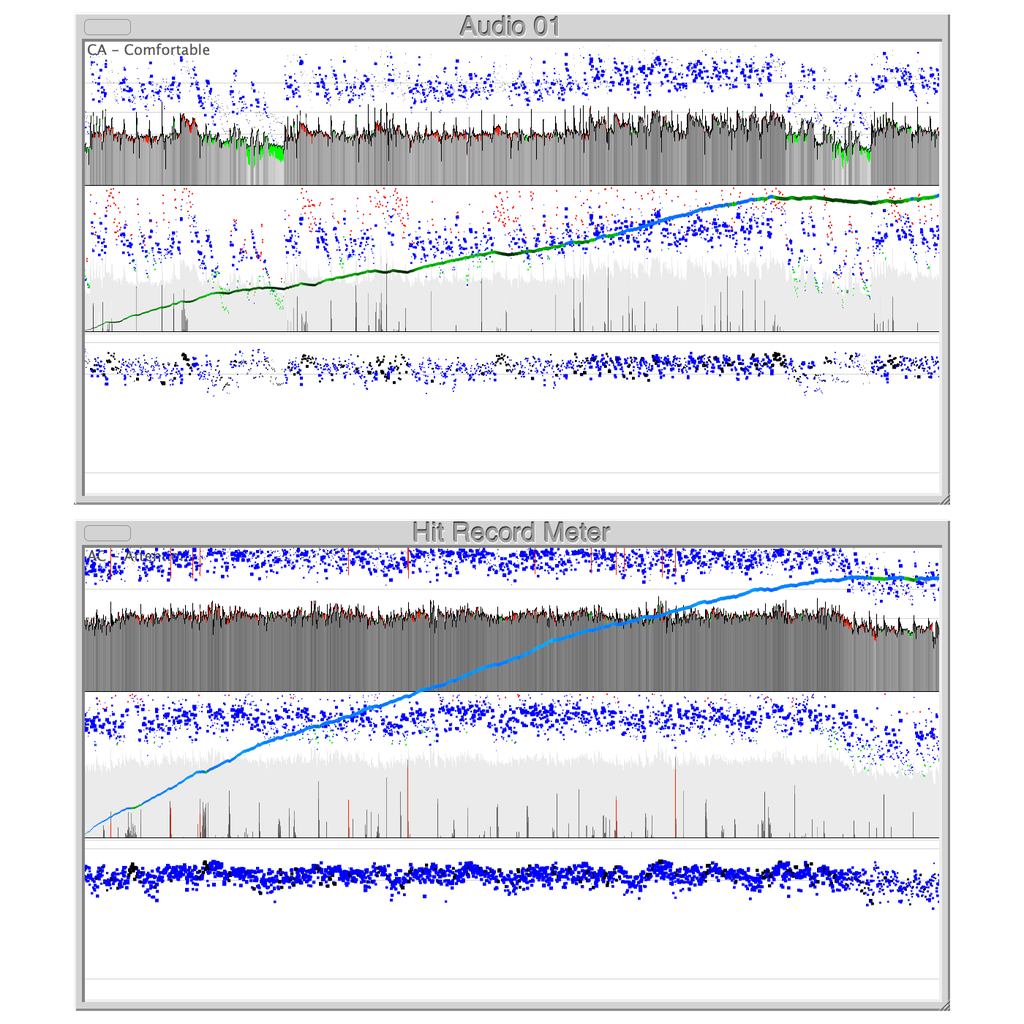
The "hit-ness" trace that overlays all of this rises and falls, and changes colour, as the sonic characteristics of the audio change. The line turns green to indicate that the mix has commercial potential, and blue where it is very attention grabbing. This trace always starts from zero, so you have to allow the track to run a while before it starts to become useful.
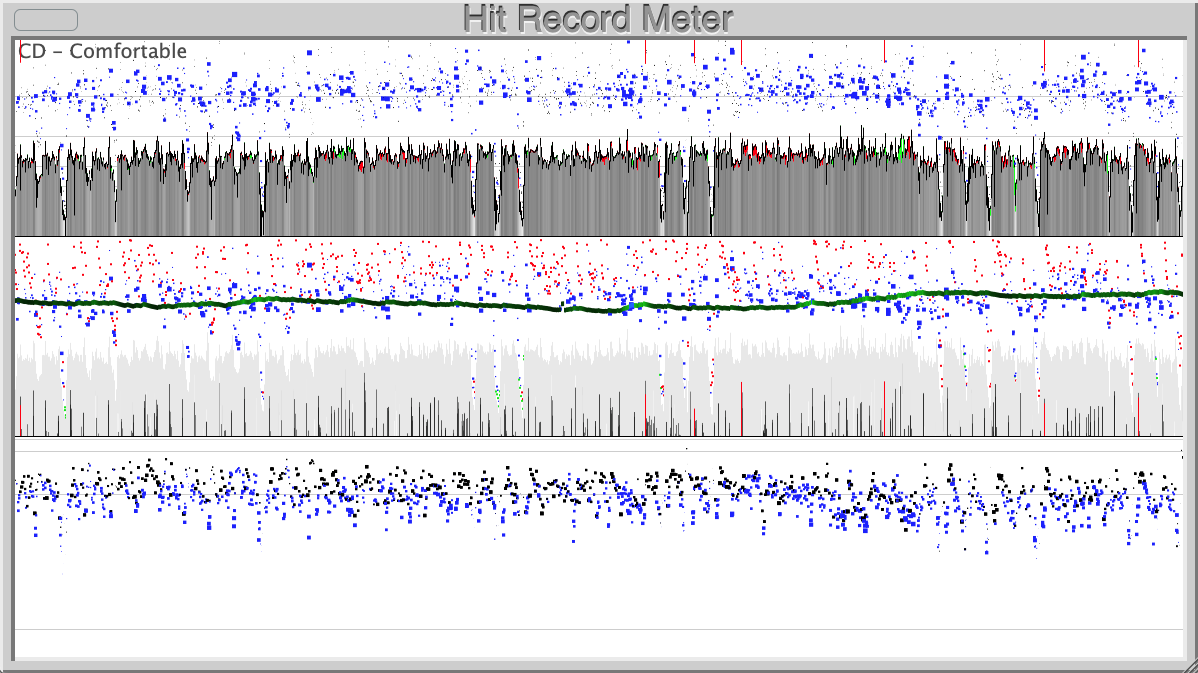
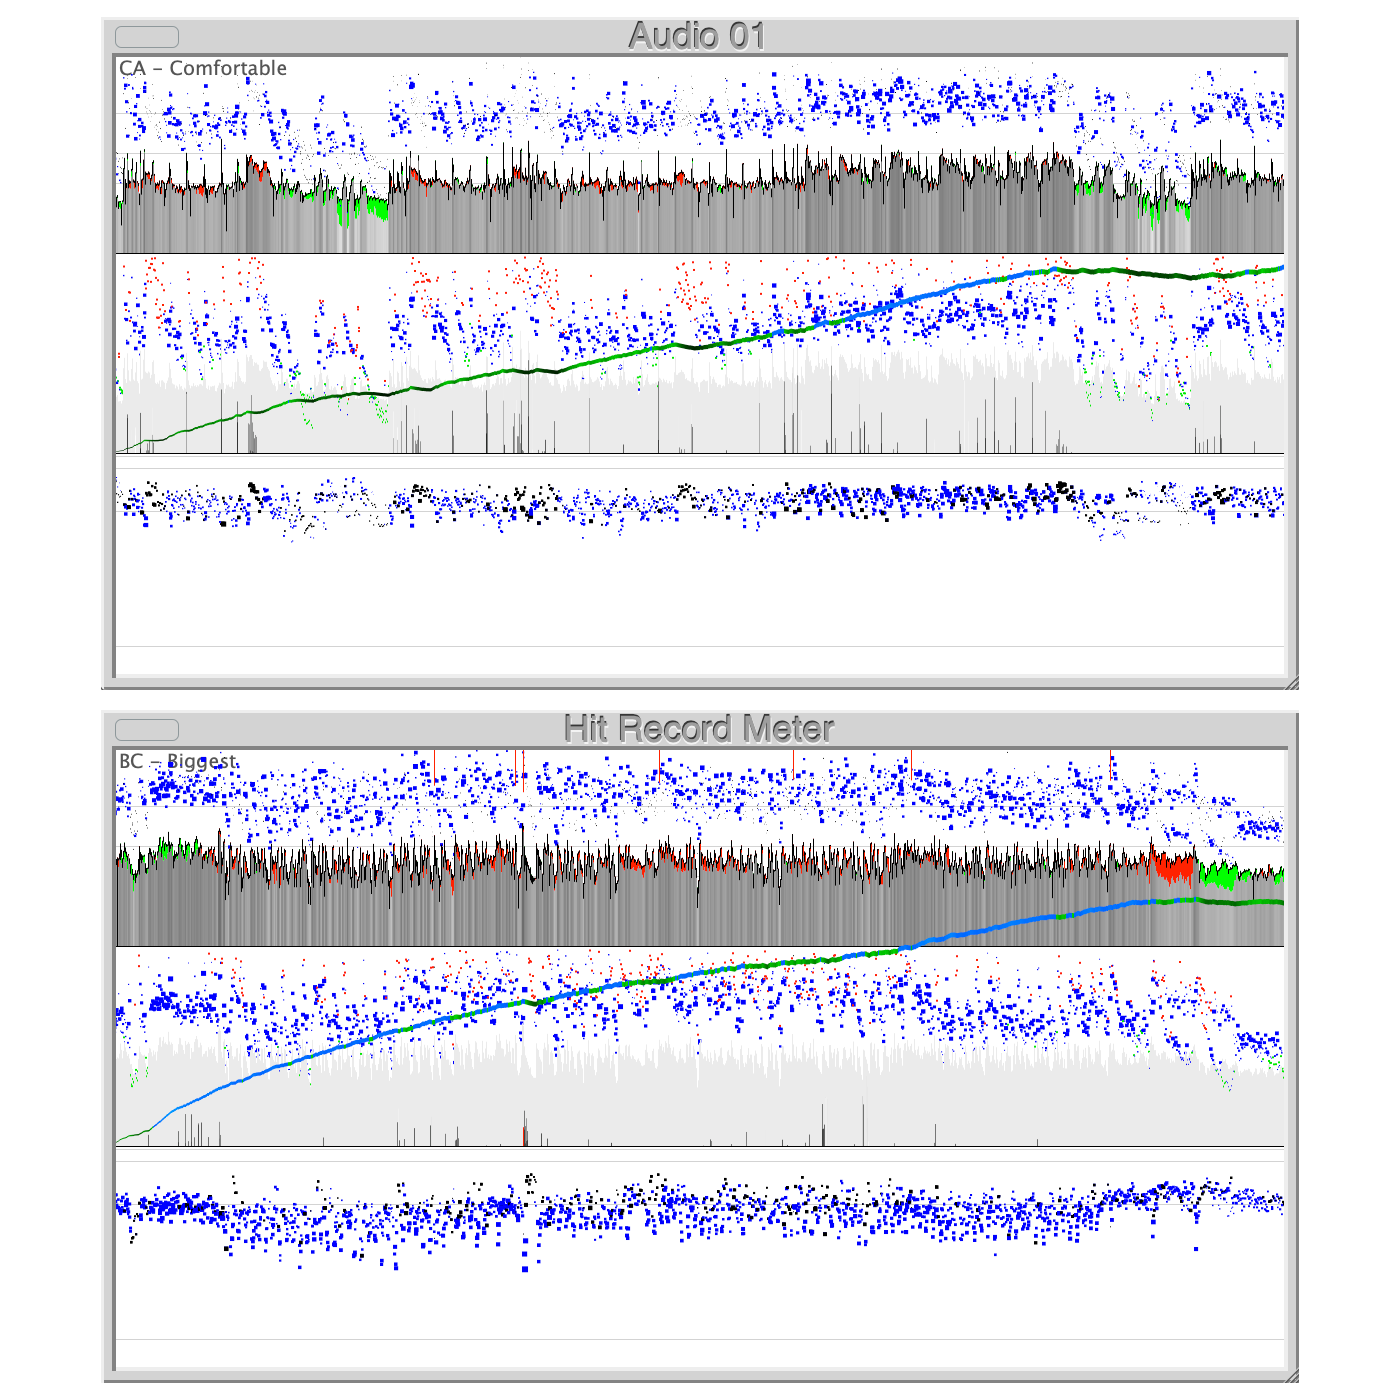
The "hit-ness" measure is also boiled down to a two-character readout, running from AA to FF, along with a short descriptive statement for the value shown: A stands for "Attention", B is "Biggest", C is "Comfortable", D is "Deep Vibe" and E is "Even More Chill". F indicates nothing much is going on and so has no description. We found these descriptions to be fairly pointless... after all, would you describe Pantera's Walk as sounding "comfortable"? No, neither would we!
Does it actually work?
But what is meant by "comfortable" anyway? How does one define "commercial potential" and "attention-grabbing"? Is it really possible to boil down a bunch of objective measurements into a judgement on something as subjective as whether a mix sounds good or not? The best way to find out is to run some audio through HRM.
We started by analysing music from classic albums that predate the arrival of CDs and the associated loudness wars. These tend to exhibit all of the elements audiophiles wax lyrical about: wide crest factor (I.E. difference between peak and RMS level), tight correlation between signal peaks and slew energy peaks, and a zero-crossing frequency that centres around the mid to upper-mid range.
Interestingly, HRM does seem to be sensitive to how improvements in recording technology are reflected in the overall tone and fidelity of the sound, with later classics such as Queen's Bohemian Rhapsody scoring more strongly than older recordings such as The Beatles' A Day In The Life.
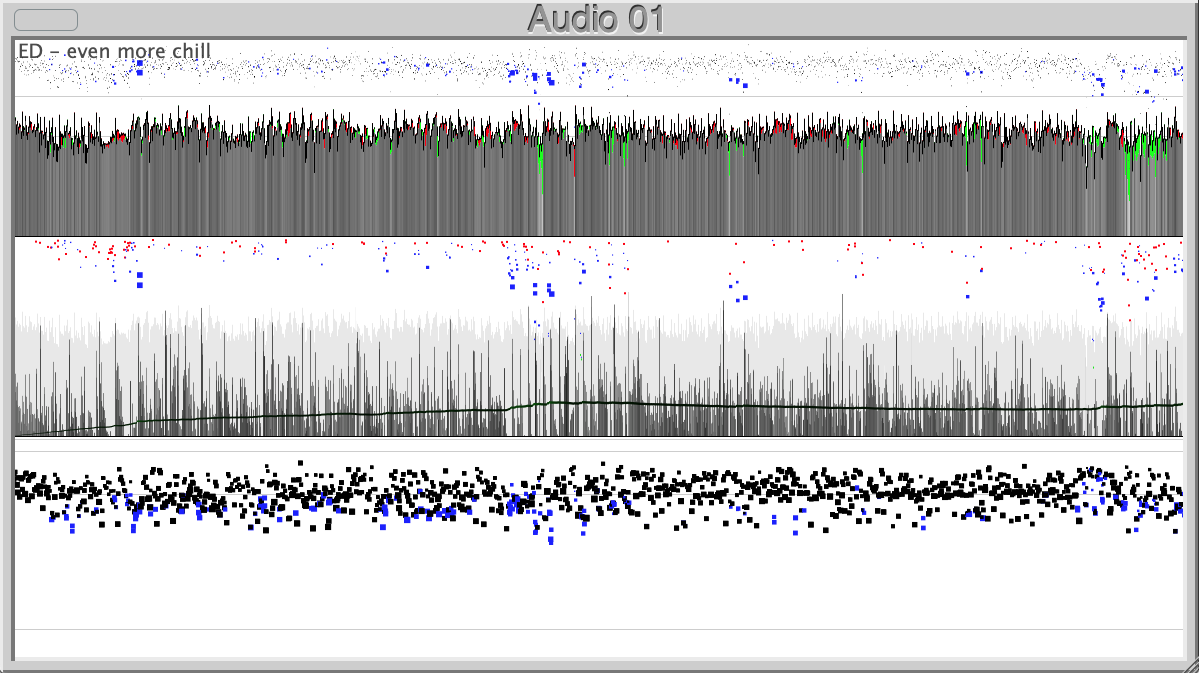
HRM tends to not like the sound of loudness-wars-era music. This reflects the audiophiles' assertion that over-pushing loudness and restricting crest factor makes for poor-sounding music. However, there are styles of music for which the "loudenated" (as Chris puts it) sound is intrinsic to the musical style, and HRM overlooks the explosive excitement and energy that such music can possess.
The worst atrocities of the loudness wars are now behind us of course, thanks to the introduction of the LUFS standard and LUFS-based normalisation imposed by streaming platforms. Nevertheless, modern production and mastering styles still tend to sound big and loud.
What HRM reveals, though, is that the tricks being employed are far more subtle than simply crushing the crest factor. It shows that adding a lot of top-end energy to transients is effective, as is aiming for a strong and focussed mid-range.
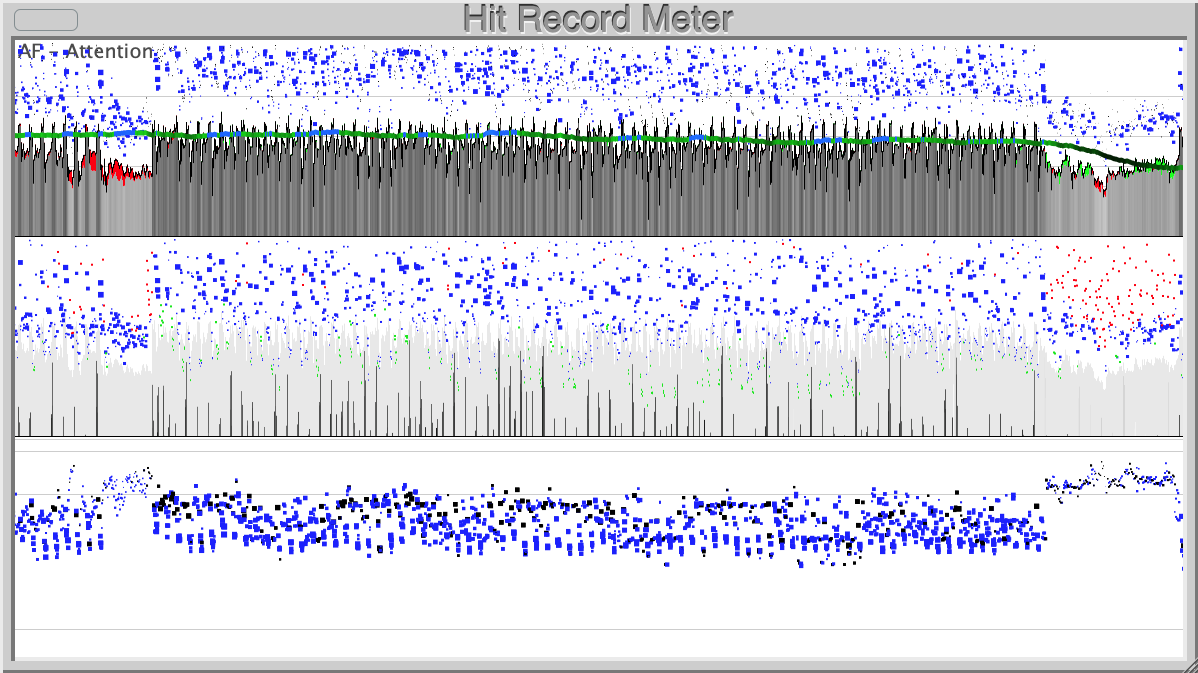
That said, not all modern mixes score well – it all depends on production style. As an example take a look below at the readouts from two very recent releases: Billie Eilish's Birds Of A Feather and Chase & Status' Backbone. HRM correctly identifies that Birds Of A Feather has a strong "hit-ness", but seems to think that Backbone has much less commercial potential.
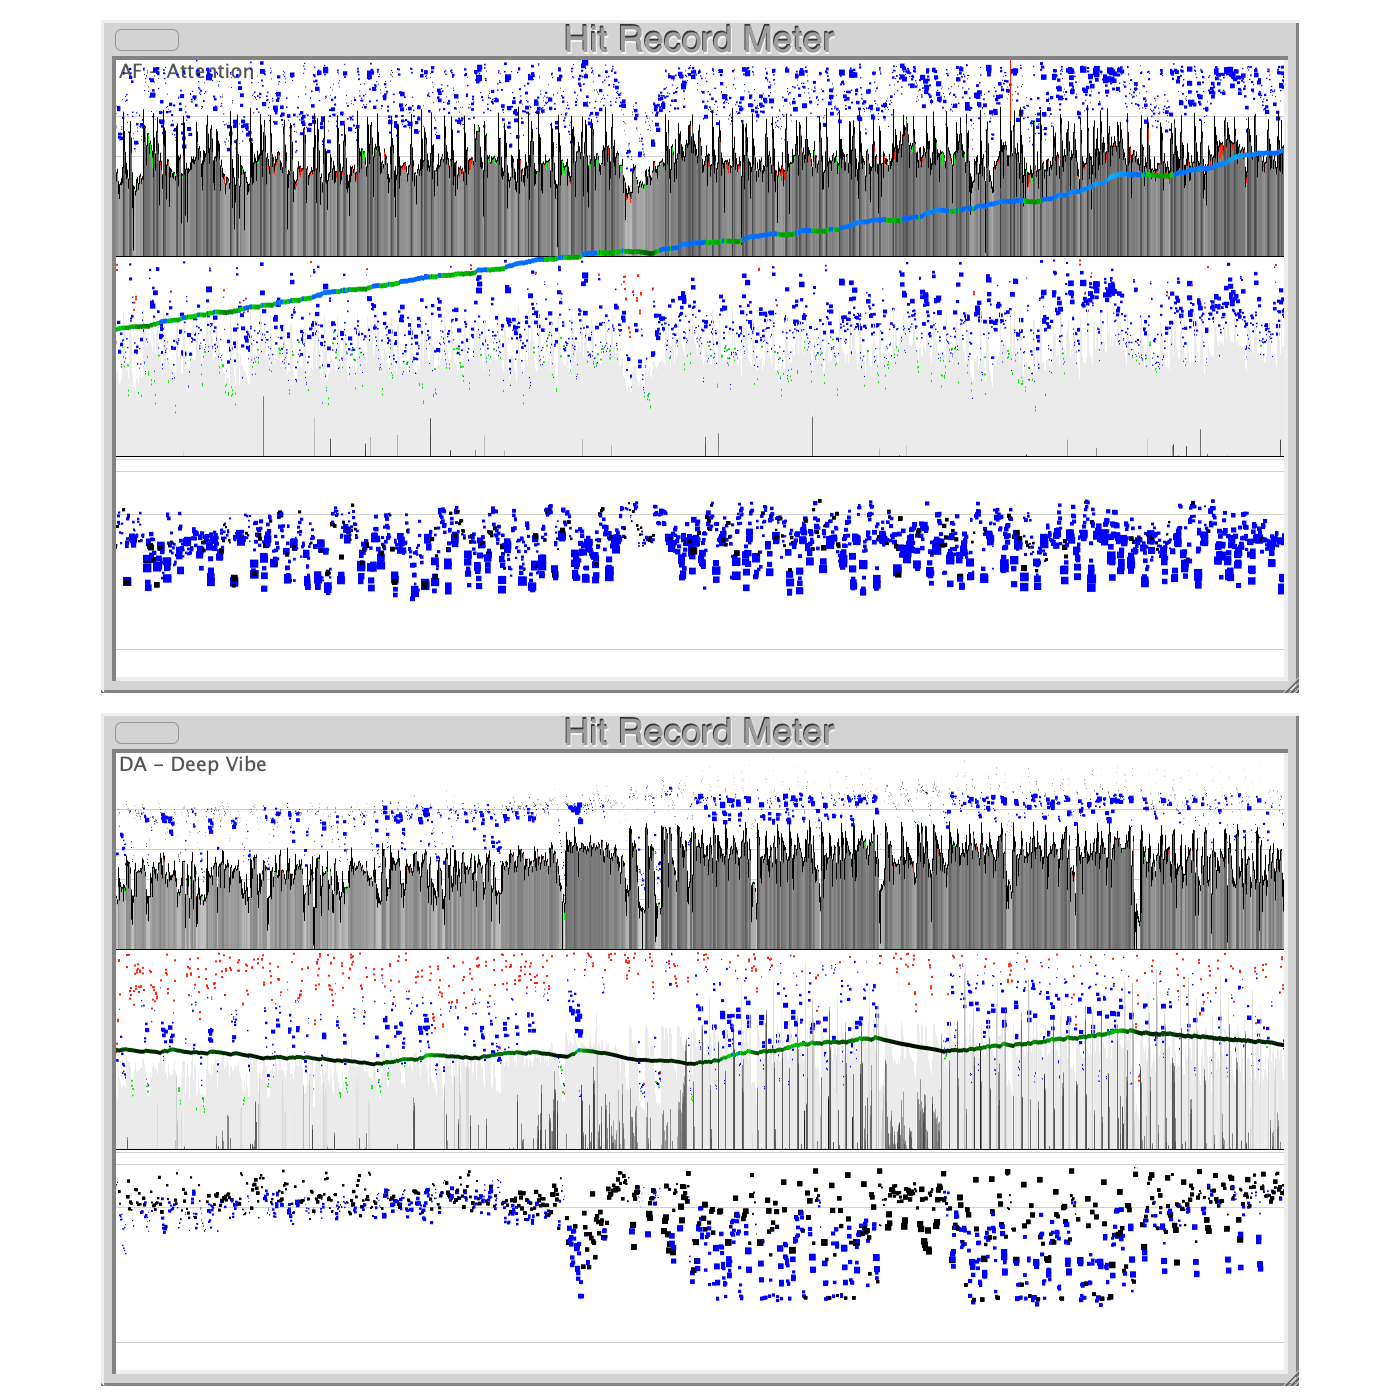
Listening to the two tracks back-to-back reveals that whilst Birds Of A Feather has an old-school production style, with a warm sound and loads of peak headroom, Backbone is far crisper, louder and in-your-face. But we couldn't say one is better than the other and, the fact is, at the time of writing Backbone is higher up the singles download charts than Birds Of A Feather.
Loud and proud
The Loudness Wars broke out not long after the arrival of compact discs, as artists, bands and producers tried to ensure that their music sounded louder on disc than anybody else's. The trick to doing this is to reign-in signal peaks using a limiter, thereby creating headroom that can be filled by adding gain to the audio to make it louder overall.
Doing this squishes the crest factor (ie, the difference between peak and RMS signal levels) down to a few decibels but, so the argument goes, our hearing is not sensitive to short transient peaks anyway so they aren't important.
"But, but, but...!", scream the audiophiles. "We may not /hear/ the peaks as such, but we are still aware of them. They still impact on our aural experience. It's all psychoacoustics, innit!".
"Psychowhatnow?" asked the loudness warriors. And so it went on.
To relate all of this back to HRM we need to look at its top row peak/RMS readout. When fed with a song that's been mixed and mastered to maximise loudness, the space above the RMS trace is narrower and the peak dots all fall within a restricted band.
Conversely, a pre-loudness-wars track will tend to show a much wider area above the RMS trace, and the peak cloud will spread throughout this wider space. HRM judges the latter to have a better "hit sound" than the former, but is this correct or just personal bias? It is without doubt that classic analogue recordings can sound wonderful, and that loudness-wars-era albums can sound intense and tiring to listen to. It is also true that there are plenty of older recordings that sound ropey, and that "loudified" tracks can have an explosive energy that is both compelling and exciting.
It's all psychoacoustics, innit!
Psychoacoustics is the study of how humans perceive and respond to sound. Being hard-wired into our brains by evolution means that much of this perception and response is intrinsic and subconscious. Any music that takes advantage of psychoacoustics, whether by intention or by happy accident, will therefore be more attention-grabbing and interesting to listen to.
Fascinatingly, HRM knows this too, and knows there is more to an attention-grabbing mix than crest factor alone.
Our brains garner more information from complex sounds than from simple ones, so we find them more exciting and interesting; we are particularly sensitive to the frequencies involved in human speech so we enjoy (or dislike) the timbre of a singer's voice as much as the words they're singing, and practically all lead instruments – guitars, synths, violins, etc. etc. – do their main work within this same frequency range. Sudden loud sounds are impossible to ignore, so we can't get enough of drums and percussive sounds.
HRM's slew energy and zero crossing meters bring factors such as these into its final "hit-ness" judgement. The former helps us to analyse and understand details about the higher frequencies within the audio. When intense high frequencies (ie those with more slew energy) align with the transient peaks shown in the peak/RMS meter, our subconscious ear is tickled pink, and HRM's "hit-ness" trace ramps up accordingly.
Is it a hit?
What we can conclude from all of this is that HRM is surprisingly good at identifying great-sounding audio, but that it also has blind spots that indicate a bias towards certain production styles and techniques. It is without question that those styles and techniques deliver a great sound, and so using HRM is certainly helpful in this regard.
However, the production styles HRM doesn't like are just as valid as those it does, and also result in pro-grade mixes. If you are inclined towards such styles then the plugin may prove less useful, and may even lead you away from the sound you are trying to achieve.
Ultimately, what we found ourselves asking is this: do high-scoring mixes score well because their producers understood the principles HRM is measuring, or because they were good at their jobs and knew how to use their equipment to achieve the sound they wanted to hear?
We think it's the latter - there's no substitute for your ears. Nevertheless, the plugin is fun - and free - so download it and see what it makes of your productions. Who knows, you might just make a hit record.
“Without investment in music education our talent pipeline is at risk of drying up along with the huge opportunities for economic growth it brings”: UK Music draws up five point plan to “turbocharge” music education
“These tariff actions will have a long-term effect on musicians worldwide”: The CEO of NAMM urges Trump to dump tariffs on components of musical instruments


